
CLFD on Nasdaq

Clearfield, Inc.
Logo: clearfieldconnection.com4
American telephone and telegraph apparatus company based in United States1
In its 2025 annual report the company says: “We design, manufacture, and distribute fiber protection, fiber management, and fiber delivery solutions to enable rapid and cost-effective fiber-fed deployment throughout the broadband service provider space primarily across North America.”8 It was founded in 2008.1 Its shares trade on Nasdaq under the symbol CLFD.1
Price unavailable
Last updated Oct 20, 2026.
Overview
Compare with Zhone Technologies, Audiocodes Ltd. or Sonim Technologies, or pick any stock.
- TickerCLFD on Nasdaq1
- IndustryTelephone & Telegraph Apparatus1
- HeadquartersUnited States1
- Websitewww.clearfieldconnection.com
- Legal formcompany1
- Listed onNasdaq (CLFD), New York Stock Exchange1
- Incorporated inMN6
- Business address7050 Winnetka Ave. N., Suite 100, Brooklyn Park, Mn 554286
- Filer categoryAccelerated filer6
- LEI529900M4S2OQ1ADPR5373
- StatusActive3
- LEI statusLapsed (not renewed)3
- Registered address7050 Winnetka Ave. N., Suite 100, 55428 Brooklyn Park, United States3
- Registered withOffice of the Minnesota Secretary of State Business & Lien system, 3J-6873
See how the biggest companies compare on our leaderboards
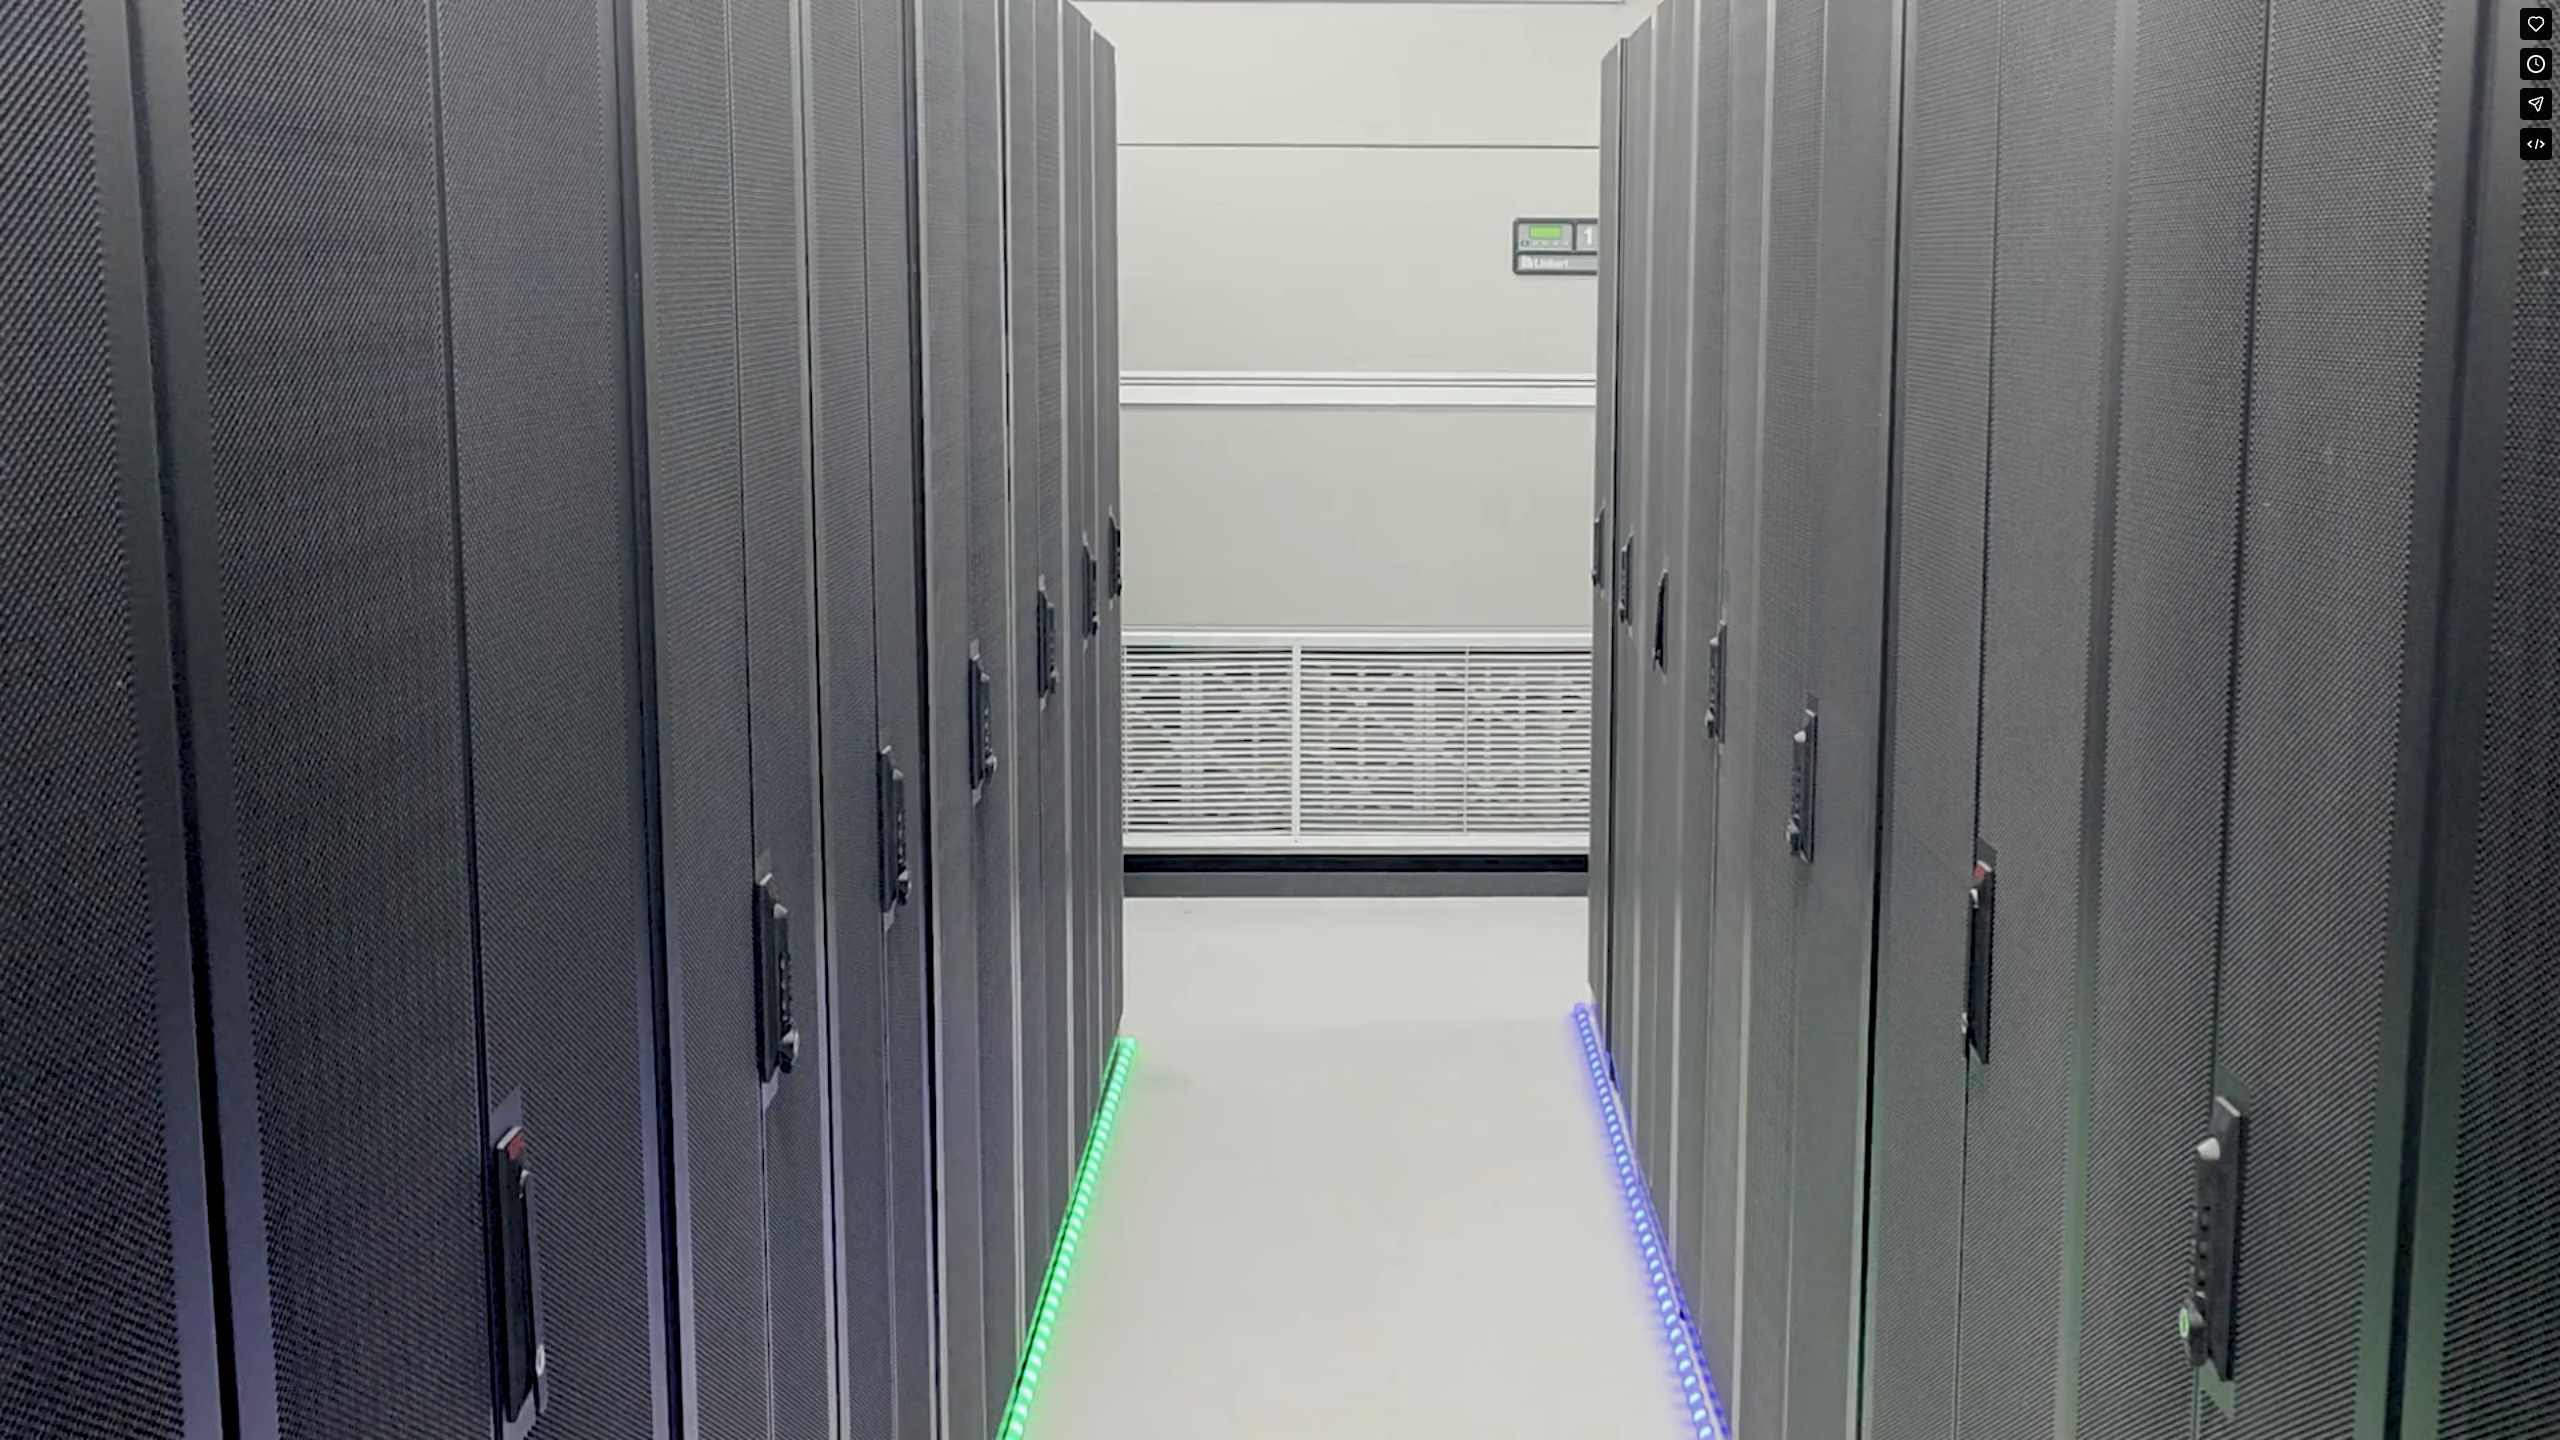
We design, manufacture, and distribute fiber protection, fiber management, and fiber delivery solutions to enable rapid and cost-effective fiber-fed deployment throughout the broadband service provider space primarily across North America. Our “fiber to anywhere” platform serves the unique requirements of Community Broadband customers (Tier 2 and 3 telco carriers, utilities, municipalities, and alternative carriers), Multiple System Operators (cable television), Large Regional Service Providers (ILEC operating a multi-state network with more than 500,000 subscribers), National Carriers (wireline/wireless national telco carriers (Tier 1)), and International customers (primarily Europe, Canada, Mexico, and Caribbean Markets).8 From its latest annual report
Financials
From the company’s reports to the SEC. Every number links to the filing it came from.
Key numbers, fiscal 2025
Where the money goes
Where each dollar of revenue went, fiscal 2025
- Cost of revenue65¢$99.6M
- Research and development2¢$2.4M
- Selling, general and admin32¢$48.4M
- Income tax2¢$2.4M
Out of $150.1M in revenue.5 The company lost money this year.
Financial statements
Every line of the income statement as filed: the last 3 fiscal years, latest first.5
| Period ending | 2025-09-30 | 2024-09-30 | 2023-09-30 |
|---|---|---|---|
| Net sales | $150.1M | $125.6M | $225.7M |
| Cost of sales | $99.6M | $99.7M | $145.9M |
| Gross profit | $50.5M | $25.8M | $79.9M |
| Selling, general and administrative | $48.4M | $45.1M | $42.3M |
| Income (loss) from continuing operations | $2.1M | -$19.2M | $37.6M |
| Net investment income | $6.5M | $7.5M | $5.2M |
| Interest expense | $0 | $0 | -$170.0K |
| Income (loss) from continuing operations before income taxes | $8.7M | -$11.8M | $42.6M |
| Income tax expense (benefit) | $2.4M | -$3.2M | $8.9M |
| Income (loss) from continuing operations, net of tax | $6.3M | -$8.5M | $33.7M |
| (Loss) from discontinued operations, net of tax | -$3.9M | -$3.9M | -$1.2M |
| (Loss) from impairment of discontinued operations, net of tax | -$10.4M | $0 | $0 |
| Net (loss) income | -$8.1M | -$12.5M | $32.5M |
| Continuing operations (in dollars per share) | $0 | -$1 | $2 |
| Discontinued operations (in dollars per share) | -$1 | -$0 | -$0 |
| Basic (loss) earnings per share (in dollars per share) | -$0.58 | -$0.85 | $2.17 |
| Continuing operations (in dollars per share) | $0 | -$1 | $2 |
| Discontinued operations (in dollars per share) | -$1 | -$0 | -$0 |
| Diluted (loss) earnings per share (in dollars per share) | -$0.58 | -$0.85 | $2.17 |
| Basic (in shares) | 14.0M shares | 14.6M shares | 15.0M shares |
| Diluted (in shares) | 14.0M shares | 14.6M shares | 15.0M shares |
No quarter-by-quarter statement was filed.
Every line of the balance sheet as filed: the last 4 fiscal years (annual) or 4 quarters (quarterly), latest first.5
| Period ending | 2025-09-30 | 2024-09-30 | 2023-09-30 | 2022-09-30 |
|---|---|---|---|---|
| Cash and cash equivalents | $21.5M | $14.1M | ||
| Short-term investments | $84.5M | $114.8M | ||
| Accounts receivables, net | $18.0M | $13.8M | ||
| Inventories, net | $42.0M | $56.1M | ||
| Prepaid and other current assets | $11.2M | $10.5M | ||
| Current assets held for sale | $21.3M | $20.2M | ||
| Total current assets | $198.5M | $229.6M | ||
| Property, plant and equipment, net | $9.7M | $15.9M | ||
| Long-term investments | $59.8M | $24.5M | ||
| Goodwill | $4.7M | $4.7M | ||
| Intangible assets, net | $9.4M | $4.7M | ||
| Right-of-use lease assets | $8.4M | $11.0M | ||
| Deferred tax asset | $10.3M | $6.1M | ||
| Other non-current assets | $608.0K | $963.0K | ||
| Non-current assets held for sale | $4.8M | $17.9M | ||
| Total assets | $306.2M | $315.3M | ||
| Current portion of lease liability | $2.8M | $2.5M | ||
| Accounts payable | $7.0M | $2.8M | ||
| Accrued compensation | $6.6M | $4.7M | ||
| Accrued expenses | $2.2M | $2.3M | ||
| Current liabilities held for sale | $18.0M | $12.1M | ||
| Total current liabilities | $36.6M | $24.4M | ||
| Long-term portion of lease liability | $5.9M | $8.8M | ||
| Non-current liabilities held for sale | $7.5M | $6.4M | ||
| Total liabilities | $50.0M | $39.5M | ||
| Preferred stock, $.01 par value; 500,000 shares; no shares issued or outstanding | $0 | $0 | ||
| Common stock, authorized 50,000,000, $.01 par value; 13,839,675 and 14,229,107 shares issued and outstanding as of September 30, 2025 and September 30, 2024, respectively | $138.0K | $142.0K | ||
| Additional paid-in capital | $147.4M | $159.6M | ||
| Accumulated other comprehensive income | $1.7M | $1.1M | ||
| Retained earnings | $106.9M | $115.0M | ||
| Total shareholders equity | $256.2M | $275.8M | $315.2M | $147.6M |
| Total Liabilities and Shareholders Equity | $306.2M | $315.3M | ||
| Preferred Stock, Par or Stated Value Per Share (in dollars per share) | $0.01 | $0.01 | ||
| Preferred Stock, Shares Authorized (in shares) | 500.0K shares | 500.0K shares | ||
| Preferred Stock, Shares Issued (in shares) | 0 shares | 0 shares | ||
| Preferred Stock, Shares Outstanding (in shares) | 0 shares | 0 shares | ||
| Common Stock, Shares Authorized (in shares) | 50.0M shares | 50.0M shares | ||
| Common Stock, Par or Stated Value Per Share (in dollars per share) | $0.01 | $0.01 | ||
| Common Stock, Shares, Outstanding (in shares) | 13.8M shares | 14.2M shares | ||
| Common Stock, Shares, Issued (in shares) | 13.8M shares | 14.2M shares |
Cash flow is reported year to date, not quarter by quarter, so there are no separate quarterly figures.
Every line of the cash flow as filed: the last 3 fiscal years, latest first.5
| Period ending | 2025-09-30 | 2024-09-30 | 2023-09-30 |
|---|---|---|---|
| Net (loss) income | -$8.1M | -$12.5M | $32.5M |
| Loss from discontinued operations, net of tax | $3.9M | $3.9M | $1.2M |
| Loss from impairment of discontinued operations, net of tax | -$10.4M | $0 | $0 |
| Depreciation and amortization | $6.1M | $5.9M | $4.6M |
| (Gain) loss on sale of assets | -$284.0K | $10.0K | $3.0K |
| Amortization of premium and discount on investments, net | -$1.8M | -$4.4M | -$3.5M |
| Deferred taxes | -$4.2M | -$3.4M | -$2.0M |
| Stock-based compensation | $4.6M | $4.4M | $3.6M |
| Accounts receivable | -$3.5M | $6.5M | $27.1M |
| Inventories, net | $13.6M | $26.5M | -$11.1M |
| Other assets | $173.0K | -$9.5M | -$309.0K |
| Accounts payable and accrued expenses | $5.6M | $264.0K | -$27.4M |
| Net cash provided by operating activities (continuing) | $26.6M | $17.8M | $24.6M |
| Purchases of property, plant and equipment and intangible assets | -$4.7M | -$8.0M | -$7.4M |
| Proceeds from sale of property and equipment | $903.0K | $45.0K | $0 |
| Purchases of investments | -$119.1M | -$159.4M | -$210.9M |
| Proceeds from maturities of investments | $115.9M | $162.1M | $107.1M |
| Net cash used in investing activities (continuing) | -$7.0M | -$5.3M | -$111.3M |
| Repayment of long-term debt | $0 | $0 | -$16.7M |
| Proceeds from issuance of common stock under employee stock purchase plan | $595.0K | $586.0K | $611.0K |
| Repurchase of shares for payment of withholding taxes for vested restricted stock grants | -$494.0K | -$493.0K | -$1.2M |
| Withholding related to exercise of stock options | -$689.0K | -$9.0K | -$491.0K |
| Net proceeds from issuance of common stock | $0 | $0 | $130.3M |
| Issuance of stock under equity compensation plans | $0 | $1.0K | $954.0K |
| Repurchase of common stock | -$16.7M | -$33.4M | $0 |
| Net cash (used in) provided by financing activities (continuing) | -$17.2M | -$33.3M | $113.4M |
| Net cash provided by (used in) operating activities | $2.9M | $4.5M | -$6.2M |
| Net cash used in investing activities | -$1.8M | -$1.6M | -$945.0K |
| Net cash provided by (used in) financing activities | $3.0M | -$3.6M | $1.6M |
| Net cash provided by (used in) discontinued operations | $4.1M | -$791.0K | -$5.5M |
| Effect of exchange rates on cash and cash equivalents | -$97.0K | -$81.0K | -$2.0K |
| Net increase (decrease) in cash and cash equivalents | $6.3M | -$21.7M | $21.2M |
| Change in cash held for sale | $1.1M | -$19.0K | -$1.0M |
| Cash paid for income taxes | $1.7M | $160.0K | $12.8M |
| Cash paid for interest | $0 | $0 | $170.0K |
| Right of use assets obtained through lease liabilities | $0 | $4.4M | $0 |
| Cashless exercise of stock options | $2.5M | $19.0K | $566.0K |
No quarter-by-quarter statement was filed.
Corporate structure
Clearfield, Inc. sits at the top of its group. 4 entities, 3 countries on record. Switch between the flow chart and the network, and select any entity to see its details.
Major holders of Clearfield, Inc.
- Orin Hirschman Filed SCHEDULE 13G on Clearfield, Inc., latest Jul 27, 2026
- ACK Asset Management LLC Filed SCHEDULE 13G on Clearfield, Inc., latest Apr 15, 2026 (3 filings since Feb 14, 2025)
- VANGUARD GROUP INC Filed SCHEDULE 13G/A on Clearfield, Inc., latest Mar 26, 2026 (3 filings since Feb 9, 2023)
- Ronald G. Roth Filed SCHEDULE 13G/A on Clearfield, Inc., latest Feb 13, 2026 (5 filings since Feb 3, 2022)
- MAIRS & POWER INC Filed SCHEDULE 13G on Clearfield, Inc., latest May 15, 2025
- FRANKLIN MUTUAL ADVISERS LLC Filed SC 13G/A on Clearfield, Inc., latest Apr 9, 2024 (2 filings since Jan 30, 2024)
- Clearfield, Inc. Brooklyn Park, Minnesota, United States
- Clearfield Finland Oy Subsidiary · Finland
- Nestor Cables Baltics OÜ Subsidiary · Estonia
- Nestor Cables Oy Subsidiary · Finland
Built from parent and subsidiary links from GLEIF, the Global Legal Entity Identifier Foundation (CC0); subsidiaries listed in Exhibit 21 of annual reports filed with the SEC; major holders from Schedules 13D and 13G. Each entity in the chart links to its source.
What it owns
What Clearfield, Inc. reports owning in its annual reports to the SEC: buildings, land and equipment, real estate and locations, investments, intangible assets and inventory, at the end of its latest fiscal year and a year before.
Property and equipment
| Item | Latest | A year before | Change |
|---|---|---|---|
| Property and equipment, before depreciation | $30.9M5 Sep 30, 2025 | $33.9M5 Sep 30, 2024 | −8.9% |
| Accumulated depreciation | $21.2M5 Sep 30, 2025 | $18.0M5 Sep 30, 2024 | +17.6% |
| Property and equipment, net | $9.7M5 Sep 30, 2025 | $15.9M5 Sep 30, 2024 | −39.0% |
| Operating-lease assets (leased space) | $8.4M5 Sep 30, 2025 | $11.0M5 Sep 30, 2024 | −23.2% |
Investments
| Item | Latest | A year before | Change |
|---|---|---|---|
| Cash and cash equivalents | $21.5M5 Sep 30, 2025 | $14.1M5 Sep 30, 2024 | +51.9% |
| Marketable securities, current | $84.5M5 Sep 30, 2025 | $114.8M5 Sep 30, 2024 | −26.4% |
| Debt securities available for sale | $144.3M5 Sep 30, 2025 | $139.3M5 Sep 30, 2024 | +3.6% |
| Long-term investments | $59.8M5 Sep 30, 2025 | $24.5M5 Sep 30, 2024 | +144.1% |
Intangibles and goodwill
| Item | Latest | A year before | Change |
|---|---|---|---|
| Goodwill | $4.7M5 Sep 30, 2025 | $6.6M5 Sep 30, 2024 | −28.9% |
| Intangible assets, net (excluding goodwill) | $9.4M5 Sep 30, 2025 | $4.7M5 Sep 30, 2024 | +100.2% |
| Finite-lived intangibles, gross | $15.9M5 Sep 30, 2025 | $10.1M5 Sep 30, 2024 | +57.0% |
| Accumulated amortization | $6.6M5 Sep 30, 2025 | $5.5M5 Sep 30, 2024 | +20.1% |
| Finite-lived intangibles, net | $9.4M5 Sep 30, 2025 | $4.7M5 Sep 30, 2024 | +100.2% |
Inventory
| Item | Latest | A year before | Change |
|---|---|---|---|
| Inventory, total | $42.0M5 Sep 30, 2025 | $56.1M5 Sep 30, 2024 | −25.1% |
| Raw materials | $38.0M5 Sep 30, 2025 | $50.2M5 Sep 30, 2024 | −24.3% |
| Work in process | $2.4M5 Sep 30, 2025 | $1.1M5 Sep 30, 2024 | +117.7% |
| Finished goods | $14.1M5 Sep 30, 2025 | $19.5M5 Sep 30, 2024 | −27.7% |
Properties, in its own words
Clearfield leases an 85,000 square foot facility at 7050 Winnetka Avenue North, Brooklyn Park, Minnesota, consisting of corporate offices, manufacturing, and warehouse space.
The Company indirectly leases an approximately 318,000 square foot office, manufacturing and warehouse facility in Tijuana, Mexico that operates as a Maquiladora.
The rest of Item 2
Clearfield leases a 105,000 square foot warehouse and manufacturing facility in Brooklyn Park, Minnesota.
We believe our facilities are in satisfactory condition, suitable for their respective uses, and generally adequate to meet current needs.
Please see Note 9. Leases in the consolidated financial statements for further details regarding the terms of our leases.
Item 2 of the 10-K filed Nov 25, 2025.8
Leadership
Who has led Clearfield, Inc., and when. Pick a name to see everywhere that person has worked.
Chief executive
Chair
President
Chief financial officer
Chief operating officer
- Chief executive officerCheri B. Podzimek Aug 17, 2007 to now19
- ChairRonald G. Roth Sep 9, 2009 to Nov 20, 200920
- PresidentCheri B. Podzimek Aug 15, 2008 to Aug 25, 201421
- Chief financial officerDaniel R. Herzog Mar 3, 2011 to now22
- Chief financial officerBruce G. Blackey Sep 10, 2007 to Feb 15, 201123
- Chief operating officerJohn P. Hill Nov 5, 2008 to now24
Board members and other officers (16)
- Chief Commercial OfficerAnis Khemakhem Dec 18, 2025 to now25
- Vice PresidentDaniel R. Herzog Jul 1, 2011 to Jul 1, 201126
- Board memberKathleen Skarvan Dec 11, 2025 to now27
- Board memberRebecca Seidel Dec 11, 2025 to now28
- Board memberAdemir Sarcevic Dec 11, 2024 to now29
- Board memberCatherine T. Kelly Dec 11, 2024 to now30
- Board memberCarol Ann Wirsbinski Dec 9, 2021 to now31
- Board memberWalter Louis Jones Jr. Dec 20, 2021 to now32
- Board memberRoger G. Harding Jul 21, 2016 to Mar 6, 202433
- Board memberPatrick Goepel Sep 1, 2015 to Feb 27, 202434
- Board memberCheri B. Podzimek Aug 15, 2008 to now21
- Board memberCharles N. Hayssen Sep 15, 2008 to now35
- Board memberDonald R. Hayward Aug 30, 2007 to now36
- Board memberJohn G. Reddan Jr. Aug 21, 2006 to Nov 24, 201537
- Board memberRonald G. Roth Aug 21, 2006 to now38
- Board memberStephen L. Zuckerman Aug 21, 2006 to Feb 9, 201639
Products and brands
- networking hardware
Listed on Wikidata.1
Subsidiaries and ownership
Subsidiaries (Exhibit 21)
The subsidiaries the company lists in Exhibit 21 of its annual report, as filed.
Former names
Timeline
- Aug 5, 20268-K Results of operations40
- Jul 28, 20268-K Entered a material agreement41
- May 6, 20268-K Results of operations42
- Apr 30, 20268-K Entered a material agreement43
- Feb 27, 20268-K Shareholder vote44
- Feb 4, 20268-K Results of operations45
- Dec 12, 20258-K Bylaws or fiscal year changed46
- Nov 25, 20258-K Results of operations47
- Nov 17, 20258-K Entered a material agreement48
- Oct 29, 20258-K Executive or director change49
- Aug 6, 20258-K Results of operations50
- May 8, 20258-K Results of operations51
- 2008Founded Founded1
- Aug 17, 2007New chief executive Cheri B. Podzimek becomes CEO19
Calendar
Coming up
- Nov 24, 2026Reports results for the quarter ending Sep/2026 A year earlier it reported $0.13 a share, on Nov 25, 2025.52
When it reported results
- Aug 5, 2026Reported quarterly or annual results40
- May 6, 2026Reported quarterly or annual results42
- Feb 4, 2026Reported quarterly or annual results45
- Nov 25, 2025Reported quarterly or annual results47
- Aug 6, 2025Reported quarterly or annual results50
- May 8, 2025Reported quarterly or annual results51
- Feb 6, 2025Reported quarterly or annual results53
- Nov 7, 2024Reported quarterly or annual results54
Upcoming dates from Nasdaq's calendar; past results from the company's 8-K filings (Item 2.02). The full markets calendar
Filings
290 filings to the SEC since October 2021: 5 annual reports, 15 quarterly reports, 55 major events, 165 insider forms, 20 large holders, 30 other. The latest 20:
- Aug 6, 202610-Q EDGAR
- Aug 5, 20268-K EDGAR
- Jul 28, 20268-K EDGAR
- Jul 27, 2026SCHEDULE 13G EDGAR
- Jul 6, 20264 PRIMARY DOCUMENT EDGAR
- Jul 2, 20264 PRIMARY DOCUMENT EDGAR
- Jul 2, 20264 PRIMARY DOCUMENT EDGAR
- Jul 2, 20264 PRIMARY DOCUMENT EDGAR
- Jul 2, 20264 PRIMARY DOCUMENT EDGAR
- Jul 1, 2026144 EDGAR
- Jun 11, 20264 PRIMARY DOCUMENT EDGAR
- Jun 9, 2026144 EDGAR
- Jun 3, 20264 PRIMARY DOCUMENT EDGAR
- Jun 1, 2026144 EDGAR
- May 28, 20264 PRIMARY DOCUMENT EDGAR
- May 27, 2026144 EDGAR
- May 27, 2026SD EDGAR
- May 12, 20264 PRIMARY DOCUMENT EDGAR
- May 12, 20264 PRIMARY DOCUMENT EDGAR
- May 11, 2026144 EDGAR
The 290 filings since October 2021 can be filtered by form type and year here when JavaScript is on.
Every filing from the last five years, summarized. The full record is on SEC EDGAR.
Insider trades
40 open-market trades by officers, directors and large owners since October 2021: 14 buys and 26 sales. Grants, option exercises and gifts are left out.
| Date | Who | Trade | Shares | Price | Value | Filing |
|---|---|---|---|---|---|---|
| Jul 1, 2026 | Beranek CherylChief Executive Officer | Sale | 1,778 | $40.06 | $71.2K | Form 4 |
| Jun 9, 2026 | Khemakhem AnisChief Commercial Officer | Sale | 1,684 | $39.90 | $67.2K | Form 4 |
| Jun 1, 2026 | Beranek CherylChief Executive Officer | Sale | 7,500 | $46.92 | $351.9K | Form 4 |
| May 27, 2026 | Beranek CherylChief Executive Officer | Sale | 2,500 | $50.00 | $125.0K | Form 4 |
| May 11, 2026 | Beranek CherylChief Executive Officer | Sale | 2,500 | $45.02 | $112.5K | Form 4 |
| May 11, 2026 | Jones Walter Louis JRDirector | Sale | 2,391 | $46.05 | $110.1K | Form 4 |
| May 8, 2026 | Beranek CherylChief Executive Officer | Sale | 5,000 | $40.27 | $201.3K | Form 4 |
| Feb 19, 2026 | Hayward Donald R.Director | Sale | 3,595 | $32.00 | $115.0K | Form 4 |
| Dec 15, 2025 | ROTH RONALD GDirector | Buy | 10,000 | $30.06 | $300.6K | Form 4 |
| Feb 19, 2025 | Hill John PChief Operating Officer | Sale | 23,809 | $33.10 | $788.1K | Form 4 |
| Feb 14, 2025 | Hill John PChief Operating Officer | Sale | 13,831 | $33.05 | $457.1K | Form 4 |
| Feb 12, 2025 | Hill John PChief Operating Officer | Sale | 16,539 | $33.26 | $550.1K | Form 4 |
| Dec 5, 2024 | ROTH RONALD GDirector | Buy | 5,000 | $31.00 | $155.0K | Form 4 |
| Aug 7, 2024 | Jones Walter Louis JRDirector | Buy | 1,324 | $37.77 | $50.0K | Form 4 |
| May 23, 2024 | ROTH RONALD GDirector | Buy | 2,000 | $36.40 | $72.8K | Form 4 |
| May 10, 2024 | Wirsbinski Carol AnnDirector | Buy | 541 | $36.95 | $20.0K | Form 4 |
| Mar 5, 2024 | Harding Roger GDirector | Buy | 6,500 | $29.47 | $191.6K | Form 4 |
| Mar 4, 2024 | Jones Walter Louis JRDirector | Buy | 818 | $30.41 | $24.9K | Form 4 |
| Feb 23, 2024 | ROTH RONALD GDirector | Buy | 2,000 | $29.62 | $59.2K | Form 4 |
| Aug 8, 2023 | Wirsbinski Carol AnnDirector | Buy | 512 | $38.93 | $19.9K | Form 4 |
All 40 trades can be filtered by person here when JavaScript is on.
From Forms 4 filed with the SEC.
Major holders
Investors who own more than 5% of the shares must tell the SEC: a 13D if they may seek to influence the company, a 13G if they hold passively.
- Orin HirschmanSCHEDULE 13G, 1 filing Jul 27, 202655
- ACK Asset Management LLCSCHEDULE 13G, 3 filings Feb 14, 2025 to Apr 15, 202656
- VANGUARD GROUP INCSCHEDULE 13G/A, 3 filings Feb 9, 2023 to Mar 26, 202657
- Ronald G. RothSCHEDULE 13G/A, 5 filings Feb 3, 2022 to Feb 13, 202658
- MAIRS & POWER INCSCHEDULE 13G, 1 filing May 15, 202559
- FRANKLIN MUTUAL ADVISERS LLCSC 13G/A, 2 filings Jan 30, 2024 to Apr 9, 202460
Executive pay
What the company paid its top executives, from the summary compensation table in its proxy statement. Total pay includes salary, bonus, stock and option awards and other pay, as the company valued them.
| Year | Executive | Age | Salary | Total pay |
|---|---|---|---|---|
| 2025 | Cheryl Beranek | $460.0K | $1.6M61 | |
| 2025 | John P. Hill | $437.8K | $1.6M61 | |
| 2025 | Daniel R. Herzog | $360.4K | $980.6K61 | |
| 2024 | President and | $425.0K | $1.6M61 | |
| 2024 | Chief Operating Officer | $425.0K | $1.6M61 | |
| 2024 | Chief Financial Officer | $340.0K | $967.0K61 | |
| 2023 | Chief Executive Officer | $425.0K | $1.1M61 | |
| 2023 | Chief Operating Officer | $425.0K | $1.1M61 | |
| 2023 | Chief Financial Officer | $340.0K | $666.4K61 |
Held by these funds
The largest holders among investment managers' 13F reports for the quarter ending Jun 30, 2026, the top 25 of 100. Change is in shares since the quarter before.
13F reports cover disclosed long positions in U.S. stocks only.
SEC filer profile
How Clearfield, Inc. is registered with the Securities and Exchange Commission, from its EDGAR record and the cover page of its latest annual report.
- Name on EDGARClearfield, Inc.2
- CIK0000796505
- Employer ID (EIN)41-13472358
- Filer statusAccelerated filer not an emerging growth company; not a smaller reporting company; not a shell company8
- Incorporated inMinnesota8
- Fiscal year endsSeptember 302
- Industry code (SIC)3661 Telephone & Telegraph Apparatus2
- SEC reviewing officeOffice of Manufacturing, Division of Corporation Finance2
- Business address7050 Winnetka Ave. N., Suite 100, Brooklyn Park, MN 554282
- Phone763-476-68662
- Shares outstanding13,583,955 as of Jul 31, 202616
- Public float$347.4M as of Mar 31, 20258
- AuditorDeloitte & Touche LLP, Minneapolis, Minnesota PCAOB ID 34; it also attests to the company’s internal control over financial reporting8
- On EDGAR sinceJul 10, 19952
- Filings1,186 in all: 4 (623), 8-K (211), 10-Q (81), SC 13G/A (36), DEF 14A (32), 10-K (26), 3 (17), 4/A (16)2
All 41 form types
DEFA14A (16), 10QSB (13), 424B2 (13), SD (13), S-8 (11), 144 (10), SC 13G (8), ARS (6), UPLOAD (5), 10KSB (4), 8-K/A (4), CORRESP (4), PRE 14A (4), SCHEDULE 13G (4), SCHEDULE 13G/A (4), 424B3 (3), S-3 (3), 10QSB/A (2), 424B5 (2), DEFR14A (2), 10-C (1), 10-K/A (1), 10-K405 (1), 10-Q/A (1), 10KSB/A (1), 5 (1), 5/A (1), 8-A12G (1), NT 10-K (1), S-3ASR (1), S-8 POS (1), SC 13D (1), SC 13D/A (1)
- Latest filingsAnnual report (10-K) Nov 25, 2025
Quarterly report (10-Q) Aug 6, 2026
Proxy statement (DEF 14A) Jan 15, 2026
Latest 8-K (8-K) Aug 5, 2026
Securities registered for trading
| Class | Symbol | Exchange |
|---|---|---|
| Common Stock, $0.01 par value | CLFD | Nasdaq |
From the cover page of the 10-K filed Nov 25, 2025 (Section 12(b) of the Exchange Act).8
Risk factors and legal proceedings
The risks Clearfield, Inc. names in Item 1A of its 10-K filed Nov 25, 2025: 23 risks under these headings, as written.8
- Risks Relating to Our Operations
- We depend on the availability of sufficient supply of certain materials. Global disruptions in the supply chain for these materials could prevent us from meeting customer demand for our products.
- We rely on single-source suppliers, which could cause delays, increases in costs, or prevent us from completing customer orders, all of which could materially harm our business.
- Changes in trade policy in the U.S. and other countries may adversely affect our business and results of operations.
- Inflationary price pressures and uncertain availability of components, raw materials, labor and logistics used by us, and our suppliers could negatively impact our profitability.
- A significant percentage of our sales in the last three fiscal years have been made to a small number of customers, and the loss of these major customers could adversely affect us.
- Further consolidation among our customers may result in the loss of some customers and may reduce sales during the pendency of business combinations and related integration activities.
- Our business is dependent on interdependent management information systems.
- We may be subject to risks associated with acquisitions, and the risks could adversely affect future operating results.
- Adverse global economic conditions and geopolitical issues could have a negative effect on our business, and results of operations and financial condition.
- Product defects or the failure of our products to meet specifications or domestic content requirements could cause us to lose customers and sales or to incur unexpected expenses.
- We are dependent on key personnel.
The other 12 risks
- Cyber-security incidents, including ransomware, data breaches or computer viruses, could disrupt our business operations, damage our reputation, result in increased expense and potentially lead to legal proceedings.
- Natural disasters, extreme weather conditions or other catastrophic events could negatively affect our business, financial condition, and operating results.
- Risks Relating to Our Markets and Industry
- To compete effectively, we must continually improve existing products and introduce new products that achieve market acceptance.
- Our business is dependent upon capital spending by broadband service providers, and any delay, reduction or cancellation in capital spending by broadband service providers could adversely affect our business.
- If the telecommunications market does not continue to expand, our business may not grow as fast as we expect, which could adversely impact our business, financial condition, and operating results.
- Changes in U.S. government funding programs may cause our customers and prospective customers to delay, reduce, or accelerate purchases, leading to unpredictable and irregular purchase cycles.
- Intense competition in our industry may result in price reductions, lower gross profits, and loss of market share.
- Our success depends upon adequate protection of our patent and other intellectual property rights.
- We face risks associated with expanding our sales outside of the United States.
- Risks Relating to Our Common Stock
- Our operating results may fluctuate significantly from quarter to quarter, which may make budgeting for expenses difficult and may negatively affect the market price of our common stock.
- Our stock price has been volatile historically and may continue to be volatile. The price of our common stock may fluctuate significantly.
- Anti-takeover provisions in our organizational documents, Minnesota law, and other agreements could prevent or delay a change in control of our Company.
Legal proceedings
There are no pending legal proceedings against or involving the Company for which the outcome is likely to have a material adverse effect upon its financial position or results of operations.
The opening of Item 3, Legal Proceedings.8
Links
- Websitewww.clearfieldconnection.com1
- WikidataQ22022108
- SEC EDGARCIK 796505
Sources
The numbers on this page point here. Each one links to the record it came from.
- 1WikidataClearfield, Inc. on Wikidata
- 2
- 3
- 4Company websiteClearfield, Inc. logo
- 5
- 6
- 7
- 8
- 9
- 10
- 11
- 12
- 13
- 14
- 15
- 16
- 17
- 18
- 19
- 20SEC EDGARRonald G. Roth, Chair
- 21SEC EDGARCheri B. Podzimek, President
- 22
- 23
- 24
- 25
- 26SEC EDGARDaniel R. Herzog, Vice President
- 27SEC EDGARKathleen Skarvan, Board member
- 28SEC EDGARRebecca Seidel, Board member
- 29SEC EDGARAdemir Sarcevic, Board member
- 30SEC EDGARCatherine T. Kelly, Board member
- 31SEC EDGARCarol Ann Wirsbinski, Board member
- 32SEC EDGARWalter Louis Jones Jr., Board member
- 33SEC EDGARRoger G. Harding, Board member
- 34SEC EDGARPatrick Goepel, Board member
- 35SEC EDGARCharles N. Hayssen, Board member
- 36SEC EDGARDonald R. Hayward, Board member
- 37SEC EDGARJohn G. Reddan Jr., Board member
- 38SEC EDGARRonald G. Roth, Board member
- 39SEC EDGARStephen L. Zuckerman, Board member
- 40SEC EDGARResults of operations
- 41SEC EDGAREntered a material agreement
- 42SEC EDGARResults of operations
- 43SEC EDGAREntered a material agreement
- 44SEC EDGARShareholder vote
- 45SEC EDGARResults of operations
- 46SEC EDGARBylaws or fiscal year changed
- 47SEC EDGARResults of operations
- 48SEC EDGAREntered a material agreement
- 49SEC EDGARExecutive or director change
- 50SEC EDGARResults of operations
- 51SEC EDGARResults of operations
- 52NasdaqNasdaq calendar
- 53
- 54
- 55
- 56
- 57
- 58
- 59
- 60
- 61