

FF on NYSE

FutureFuel

Logo: futurefuelcorporation.com5

FutureFuel Corporation is a developer and producer of chemicals and biofuels.3 From Wikipedia, CC BY-SA 4.0

Price unavailable

Last updated Oct 19, 2026.

Overview

Compare with Codexis, Gevo, Inc or LanzaTech Global, Inc., or pick any stock.

  • TickerFF on NYSE1
  • IndustryIndustrial Organic Chemicals1
  • HeadquartersUnited States1
  • Websitefuturefuelcorporation.com
  • Incorporated inDE6
  • Business address2800 Gap Road, Batesville, Ar 725016
  • Filer categoryAccelerated filer, Smaller reporting company6
  • Legal formCorporation4
  • LEI529900WYQZSMWFXLA8454
  • StatusActive4
  • LEI statusLapsed (not renewed)4
  • Registered addressc/o THE CORPORATION TRUST COMPANY, CORPORATION TRUST CENTER 1209 ORANGE ST, 19801 Wilmington, United States4
  • Registered withDivision of Corporations, Department of State, 40144904
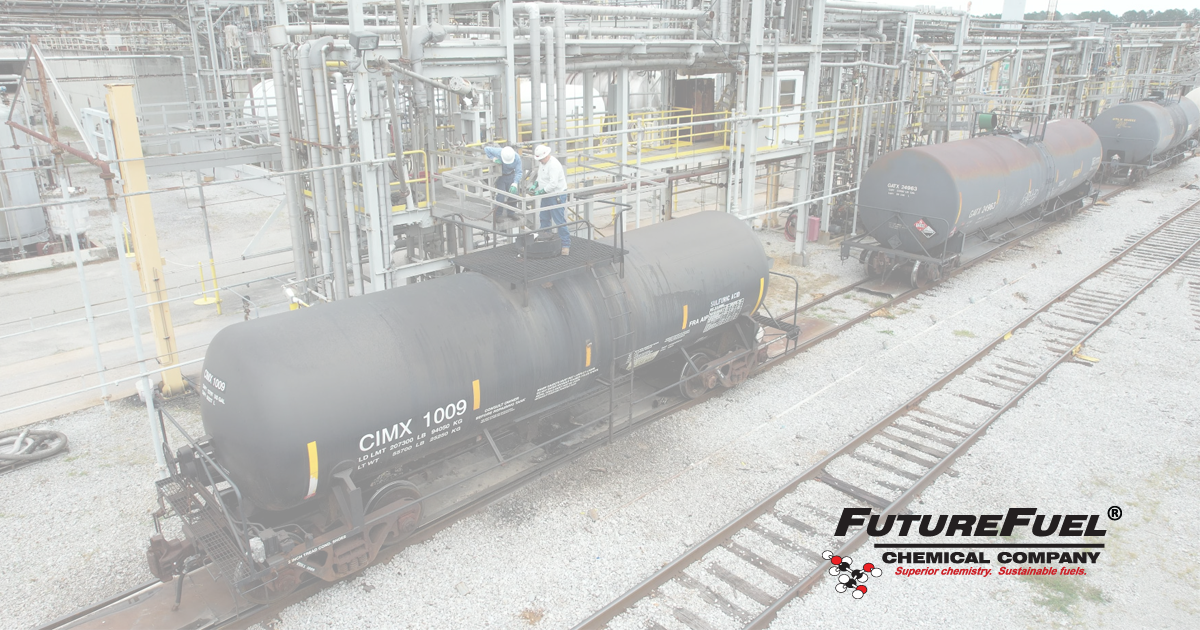
FutureFuel image from its website
Image: futurefuelcorporation.com5

FutureFuel Corporation is a developer and producer of chemicals and biofuels. It is listed on the New York Stock Exchange, with symbol FF.3

Financials

From the company’s reports to the SEC. Every number links to the filing it came from.

Key numbers, fiscal 2025

-41.2%Gross margin8
-55.3%Operating margin8
-51.6%Net margin8
-60.7%Revenue growth, 20258
-31.9%Return on equity8
-$46.0MFree cash flow8

What sells

Revenue by product, business segment and region, as the company reports it to the SEC.

Business segments

Chemicals brought in 62% of the revenue FutureFuel broke down this way in fiscal 2025.

  1. Chemicals$59.6M862%down 26% from 2024
  2. Biofuels$36.2M838%down 78% from 2024
Business segments by year
Business segments202320242025
Chemicals$79.3M$80.0M$59.6M
Biofuels$288.9M$163.3M$36.2M

Regions

United States brought in 99% of the revenue FutureFuel broke down this way in fiscal 2025.

  1. United States$94.8M899%down 61% from 2024
  2. Outside the United States$952.0K81%up 46% from 2024
Regions by year
Regions202320242025
United States$367.4M$242.7M$94.8M
Outside the United States$882.0K$654.0K$952.0K

Where the money goes

Where each dollar of revenue went, fiscal 2025

  • Research and development4¢$3.9M
  • Selling, general and admin10¢$9.7M
  • Other costs86¢$82.0M
  • Income tax0¢$165.0K

Out of $95.7M in revenue.8 The company lost money this year.

Financial statements

Revenue91011128$95.7M in 2025−53% since 2019
0$100.0M$200.0M$300.0M$400.0M2019: $205.2M$205.2M20192020: $204.5M$204.5M2020−0%2021: $321.4M$321.4M2021+57%2022: $396.0M$396.0M2022+23%2023: $368.2M$368.2M2023−7%2024: $243.3M$243.3M2024−34%2025: $95.7M$95.7M2025−61%
Gross profit91011128-$39.4M in 2025
-$50.0M0$50.0M$100.0M2019: $74.1M$74.1M20192020: $31.3M$31.3M2020−58%2021: $23.5M$23.5M2021−25%2022: $29.0M$29.0M2022+23%2023: $41.0M$41.0M2023+41%2024: $19.6M$19.6M2024−52%2025: -$39.4M-$39.4M2025
Operating income91011128-$53.0M in 2025
-$100.0M-$50.0M0$50.0M$100.0M2019: $65.3M$65.3M20192020: $22.3M$22.3M2020−66%2021: $12.9M$12.9M2021−42%2022: $17.5M$17.5M2022+36%2023: $27.4M$27.4M2023+56%2024: $6.4M$6.4M2024−77%2025: -$53.0M-$53.0M2025
Net income91011128-$49.4M in 2025
-$50.0M0$50.0M$100.0M2019: $88.2M$88.2M20192020: $46.6M$46.6M2020−47%2021: $26.3M$26.3M2021−44%2022: $15.2M$15.2M2022−42%2023: $37.4M$37.4M2023+146%2024: $15.5M$15.5M2024−59%2025: -$49.4M-$49.4M2025

Every line of the income statement as filed: the last 3 fiscal years, latest first.8

Period ending2025-12-312024-12-312023-12-31
Revenue$95.7M$243.3M$368.2M
Gross (loss) profit-$39.4M$19.6M$41.0M
Compensation expense$5.6M$4.8M$4.5M
Other expense$3.5M$3.8M$4.1M
Related party expense$674.0K$632.0K$616.0K
Research and development expenses$3.9M$4.0M$4.4M
Total operating expenses$13.6M$13.3M$13.6M
(Loss) income from operations-$53.0M$6.4M$27.4M
Interest and dividend income$3.9M$7.7M$9.6M
Interest expense-$153.0K-$138.0K-$138.0K
Gain on marketable securities$0$0$575.0K
Other income, net$0$2.4M$1.0K
Other income$3.8M$9.9M$10.0M
(Loss) income before income taxes-$49.2M$16.3M$37.4M
Income tax provision$165.0K$792.0K$1.0K
Basic (in dollars per share)-$1.13$0.35$0.85
Diluted (in dollars per share)-$1.13$0.35$0.85
Basic (in shares)43.9M shares43.8M shares43.8M shares
Diluted (in shares)43.9M shares43.8M shares43.8M shares
Net (loss) income-$49.4M$15.5M$37.4M
Other comprehensive income (loss) from unrealized net losses on available-for- sale debt securities$0$0$2.0K
Income tax effect$0$0-$1.0K
Total unrealized gain (loss), net of tax$0$0$1.0K
Comprehensive (loss) income-$49.4M$15.5M$37.4M

Compare FutureFuel with another company

The story

In 2005 the company was founded in Clayton, Missouri as Viceroy Acquisition Corp., a Special-purpose acquisition company. In 2006 Viceroy acquired a plant in Batesville, Arkansas from Eastman Chemical and subsequently changed its name to FutureFuel. Lee Mikles was CEO from 2006 until 2013. Since 2013 Tony Novelly has been chairman and CEO.

From Wikipedia’s article on FutureFuel, shared under CC BY-SA 4.0.7

Leadership

Who has led FutureFuel, and when. Pick a name to see everywhere that person has worked.

Board members and other officers (28)

Products and brands

The company operates in two segments: chemicals and biofuels.

The company has a wholly owned subsidiary named FutureFuel Chemical Company, which develops various chemical products selling to third party customers. The chemical segment consists of two components, which are custom manufacturing that produce chemicals for specific customers, and performance multi-customer specialty chemicals. During 2011, about 50% of the company's revenue came from manufacturing specialty chemicals.

The biofuel segment mainly produce biodiesel, as well as petrodiesel. This operation segment is in central Arkansas, where the company owns 2,200 acres of land six miles southeast of Batesville, Arkansas.

From Wikipedia’s article on FutureFuel, shared under CC BY-SA 4.0.7

Former names

  • Viceroy Acquisition CORPSep 2, 2005 to Jul 31, 20066

Timeline

  1. Sep 3, 2024New chief executive Roeland Polet becomes CEO17
  2. Jun 3, 2024New chief executive McKinlay Thomas becomes CEO16
  3. May 13, 2014New chief executive Paul A. Novelly becomes CEO18
  4. Jul 19, 2007New chief executive Lee E. Mikles becomes CEO19

Filings

184 filings to the SEC since October 2021: 6 annual reports, 17 quarterly reports, 78 major events, 59 insider forms, 15 large holders, 9 other. The latest 20:

  1. Sep 23, 20268-K EDGAR
  2. Aug 31, 20268-K EDGAR
  3. Aug 12, 2026DEF 14A EDGAR
  4. Aug 10, 202610-Q EDGAR
  5. Aug 10, 20268-K EDGAR
  6. Jul 28, 20268-K EDGAR
  7. Jun 30, 20268-K EDGAR
  8. Jun 26, 20268-K EDGAR
  9. Jun 5, 20264 EDGAR
  10. May 11, 20268-K EDGAR
  11. May 11, 202610-Q EDGAR
  12. Apr 20, 20268-K EDGAR
  13. Mar 31, 20268-K EDGAR
  14. Mar 19, 20264 EDGAR
  15. Mar 19, 20264 EDGAR
  16. Mar 19, 20264 EDGAR
  17. Mar 19, 20264 EDGAR
  18. Mar 19, 20264 EDGAR
  19. Mar 19, 20264 EDGAR
  20. Mar 19, 20264 EDGAR

The 184 filings since October 2021 can be filtered by form type and year here when JavaScript is on.

Every filing from the last five years, summarized. The full record is on SEC EDGAR.

Insider trades

18 open-market trades by officers, directors and large owners since October 2021: 17 buys and 1 sales. Grants, option exercises and gifts are left out.

DateWhoTradeSharesPriceValueFiling
Jun 4, 2026Polet RoelandChief Executive OfficerBuy10,000$4.28$42.8KForm 4
Nov 20, 2025Polet RoelandChief Executive OfficerBuy15,000$3.20$48.0KForm 4
Apr 3, 2025Rowe Richard P.DirectorBuy15,000$3.95$59.2KForm 4
Apr 3, 2025Bedell Donald C.DirectorBuy10,000$4.00$40.0KForm 4
Nov 15, 2024Bedell Donald C.DirectorBuy10,000$5.10$51.0KForm 4
Nov 13, 2024Polet RoelandChief Executive OfficerBuy10,000$5.11$51.1KForm 4
Aug 15, 2024Manheim PaulDirectorBuy6,000$6.10$36.6KForm 4
Jun 13, 2024KRUSZEWSKI RONALD JDirectorBuy50,358$4.60$231.6KForm 4
Jun 12, 2024KRUSZEWSKI RONALD JDirectorBuy41,098$4.57$187.8KForm 4
Jun 11, 2024KRUSZEWSKI RONALD JDirectorBuy8,544$4.50$38.4KForm 4
Jun 6, 2024Lyon Charles W.Chief Commercial OfficerBuy11,400$4.36$49.7KForm 4
Jun 4, 2024EGGER TERRANCE C ZDirectorBuy5,000$4.39$21.9KForm 4
Jun 3, 2024Bedell Donald C.DirectorBuy2,025$4.15$8.4KForm 4
Jun 3, 2024Thomas McKinlayChief Executive OfficerBuy20,000$4.38$87.6KForm 4
Jun 3, 2024SPARKS ROSEChief Financial OfficerBuy5,000$4.35$21.8KForm 4
Dec 8, 2022Bedell Donald C.DirectorSale9,000$9.00$81.0KForm 4
Oct 29, 2021Bedell Donald C.DirectorBuy5,000$7.15$35.8KForm 4

From Forms 4 filed with the SEC.

Major holders

Investors who own more than 5% of the shares must tell the SEC: a 13D if they may seek to influence the company, a 13G if they hold passively.

Held by these funds

The largest holders among investment managers' 13F reports for the quarter ending Jun 30, 2026, the top 25 of 100. Change is in shares since the quarter before.

FundSharesValueShare of the fundChange
BlackRock, Inc.1,914,410$8.7M0.0%+82,521
Renaissance Technologies LLC1,433,400$6.5M0.0%−144,300
Dimensional Fund Advisors LP1,431,611$6.5M0.0%−258,493
Ameriprise Financial Inc1,315,729$5.9M0.0%+1,208,276
Vanguard Capital Management LLC1,141,243$5.2M0.0%−24,229
Two Sigma Investments, LP782,079$3.5M0.0%−45,996
Geode Capital Management, LLC660,893$3.0M0.0%−1,730
State Street Corp620,421$2.8M0.0%−915
Citadel Advisors LLC540,985$2.4M0.0%+154,337
Bridgeway Capital Management, LLC473,285$2.1M0.0%−5,129
Aqr Capital Management LLC433,132$2.0M0.0%+276,906
Millennium Management LLC411,870$1.9M0.0%New
Diametric Capital, LP331,423$1.5M0.2%+218,320
Commonwealth Equity Services, LLC307,347$1.4M0.0%+1
Empowered Funds, LLC306,085$1.4M0.0%−5,129
Morgan Stanley304,666$1.4M0.0%+25,056
Bank of New York Mellon Corp268,653$1.2M0.0%+61,623
Hartree Partners, LP260,000$1.2M0.3%No change
Jane Street Group, LLC258,722$1.2M0.0%−23,034
American Century Companies Inc257,715$1.2M0.0%−304,826
Marshall Wace, Llp232,306$1.1M0.0%−152,593
Nuveen, LLC208,320$941.6K0.0%+107,362
Northern Trust Corp206,933$935.3K0.0%−4,566
Tudor Investment Corp Et Al197,564$893.0K0.0%New
Vanguard Portfolio Management LLC176,188$796.4K0.0%+31,194

13F reports cover disclosed long positions in U.S. stocks only.

Sources

The numbers on this page point here. Each one links to the record it came from.

  1. 1
  2. 2
  3. 3
  4. 4
  5. 5
    Company websiteFutureFuel logo
  6. 6
  7. 7
  8. 8
  9. 9
  10. 10
  11. 11
  12. 12
  13. 13
  14. 14
  15. 15
  16. 16
  17. 17
  18. 18
  19. 19
  20. 20
  21. 21
  22. 22
  23. 23
  24. 24
  25. 25
  26. 26
  27. 27
  28. 28
  29. 29
  30. 30
  31. 31
  32. 32
  33. 33
  34. 34
  35. 35
  36. 36
  37. 37
  38. 38
  39. 39
  40. 40
  41. 41
  42. 42
  43. 43
  44. 44
  45. 45
  46. 46
  47. 47
  48. 48
  49. 49
  50. 50
  51. 51
  52. 52
  53. 53
  54. 54
  55. 55
  56. 56
  57. 57