
TE on NYSE

T1 Energy
Logo: t1energy.com4
Battery manufacturer based in Delaware, founded in 20201
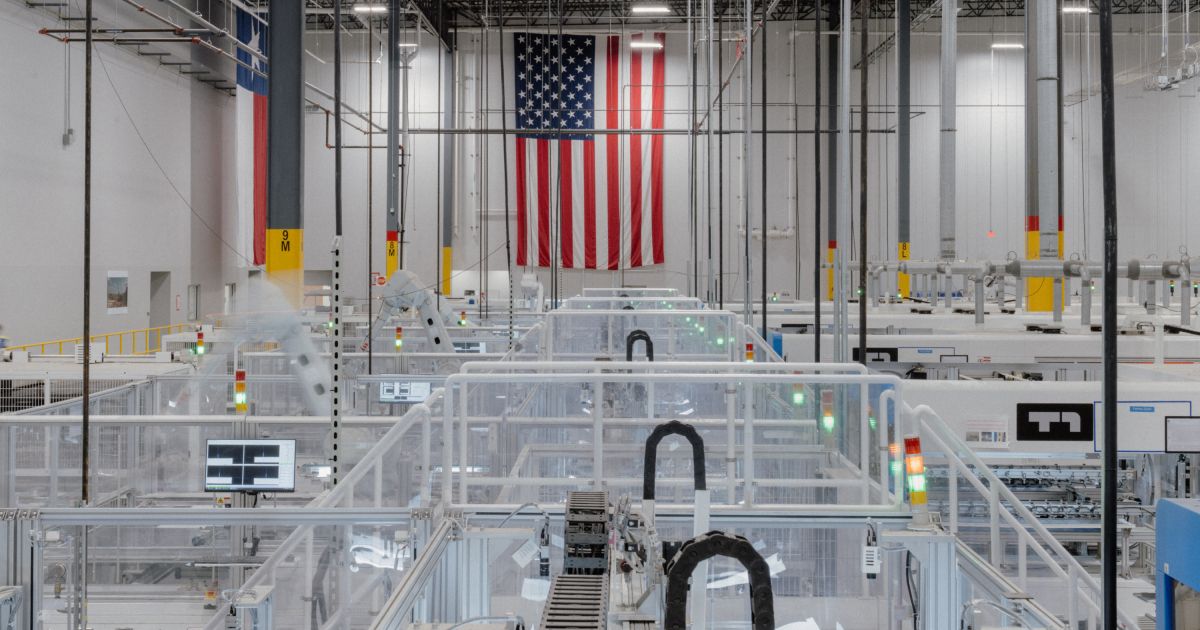
In its 2026 annual report the company says: “T1 Energy Inc. is an energy solutions provider building an integrated U.S. solar supply chain for solar modules to invigorate the United States with scalable, reliable, and low-cost energy. We currently manufacture and sell photovoltaic solar modules in Texas and are constructing our PV solar cell fab in Texas.”7 Its chief executive is Jan Arve Haugan.1
Price unavailable
Last updated Oct 20, 2026.
Overview
Compare with Wolfspeed, Silicon Laboratories or FORMFACTOR INC, or pick any stock.
- TickerTE on NYSE1
- Industrybattery industry1
- HeadquartersDelaware1
- Websitet1energy.com
- Legal formDelaware corporation1
- Incorporated inDE5
- Business address1211 E 4Th St., Austin, Tx 787025
- Filer categoryNon-accelerated filer, Smaller reporting company5
- LEI529900H0645VFXNMJ6933
- StatusActive3
- LEI statusIssued and current3
- Registered addressCORPORATION TRUST CENTER 1209 ORANGE ST, 19801 Wilmington, United States3
- Registered withDivision of Corporations, Department of State, 75307883
See how the biggest companies compare on our leaderboards
In February 2025, we changed our corporate name from FREYR Battery, Inc. to T1 Energy Inc. We will not distinguish between our prior and current corporate name and will refer to our current corporate name throughout this Annual Report on Form 10-K. As such, unless expressly indicated or the context requires otherwise, the terms “T1,” “Company,” “we,” “us,” and “our” in this document refer to T1 Energy Inc., a Delaware corporation, and, where appropriate, its subsidiaries.7 From its latest annual report
Financials
From the company’s reports to the SEC. Every number links to the filing it came from.
Key numbers, fiscal 2025
Where the money goes
Where each dollar of revenue went, fiscal 2025
- Cost of revenue73¢$699.7M
- Selling, general and admin25¢$235.3M
- Income tax2¢$19.4M
Out of $755.3M in revenue.8 The company lost money this year.
Where each dollar of operating cash went, fiscal 2025
- Capital spending83¢$78.8M
- Kept or used elsewhere17¢$16.7M
Out of $95.5M of cash from operations.8
Financial statements
| Fiscal year | 2020 | 2021 | 2022 | 2023 | 2024 | 2025 |
|---|---|---|---|---|---|---|
| Revenue | $09 | $2.9M8 | $755.3M8 | |||
| Cost of revenue | $09 | $1.7M8 | $699.7M8 | |||
| Gross profit | $09 | $1.2M8 | $55.6M8 | |||
| Research and development | $13.8M10 | $13.6M10 | $28.5M10 | |||
| Selling, general and admin | $79.2M8 | $235.3M8 | ||||
| Operating expenses | $75.6M10 | $122.5M10 | $143.0M10 | $80.2M8 | $290.1M8 | |
| Operating income | -$75.6M10 | -$122.5M10 | -$65.5M9 | -$79.0M8 | -$234.6M8 | |
| Income before tax | -$93.4M10 | -$99.1M10 | -$18.2M9 | -$82.6M8 | -$340.7M8 | |
| Income tax | $010 | $010 | $443.0K9 | -$15.8M8 | -$19.4M8 | |
| Net income | -$93.4M10 | -$98.8M10 | -$71.9M10 | -$450.6M8 | -$367.8M8 | |
| Earnings per share | -$1.2410 | -$0.8310 | -$0.519 | -$3.208 | -$2.198 | |
| Earnings per share (diluted) | -$1.2410 | -$0.8310 | -$0.519 | -$3.208 | -$2.198 | |
| Shares (weighted, basic) | 75.4M shares10 | 118.5M shares10 | 139.7M shares9 | 140.5M shares8 | 173.6M shares8 | |
| Shares (weighted, diluted) | 75.4M shares10 | 118.5M shares10 | 139.7M shares9 | 140.5M shares8 | 173.6M shares8 |
| Fiscal year | 2020 | 2021 | 2022 | 2023 | 2024 | 2025 |
|---|---|---|---|---|---|---|
| Cash | $14.9M10 | $564.0M10 | $443.1M10 | $253.3M9 | $72.6M8 | $182.4M8 |
| Receivables | $08 | $84.5M8 | ||||
| Inventory | $09 | $274.5M8 | $116.0M8 | |||
| Current assets | $579.5M10 | $312.0M9 | $572.0M8 | $663.5M8 | ||
| Property, plant and equipment | $210.8M10 | $1.7M9 | $293.6M8 | $302.3M8 | ||
| Goodwill | $09 | $74.5M8 | $57.4M8 | |||
| Intangible assets | $3.0M10 | $2.8M8 | $283.5M8 | $180.5M8 | ||
| Total assets | $827.7M10 | $732.2M9 | $1.3B8 | $1.4B8 | ||
| Accounts payable | $6.8M10 | $18.1M10 | ||||
| Short-term debt | $09 | $94.4M8 | $46.4M8 | |||
| Current liabilities | $62.6M10 | $49.2M9 | $410.1M8 | $463.6M8 | ||
| Long-term debt | $09 | $507.9M8 | $343.8M8 | |||
| Total liabilities | $107.6M10 | $97.5M9 | $1.1B8 | $1.1B8 | ||
| Retained earnings | -$203.1M10 | -$275.0M9 | -$725.2M8 | -$1.1B8 | ||
| Shareholders’ equity | $5.0M10 | $545.5M10 | $717.5M10 | $633.2M9 | $188.8M9 | $250.4M8 |
| Shares outstanding | 116.4M shares10 | 139.7M shares10 | 139.7M shares9 | 155.9M shares8 | 266.3M shares8 |
Cash flow is reported year to date, not quarter by quarter, so there are no separate quarterly figures.
| Fiscal year | 2020 | 2021 | 2022 | 2023 | 2024 | 2025 |
|---|---|---|---|---|---|---|
| Cash from operations | -$63.1M10 | -$90.0M10 | -$87.9M9 | -$102.8M8 | $95.5M8 | |
| Depreciation and amortization | $120.0K10 | $478.0K10 | $3.3M9 | $10.5M8 | $93.3M8 | |
| Stock-based compensation | $14.8M10 | $8.6M10 | $11.6M9 | $7.8M8 | $11.4M8 | |
| Capital spending | $13.8M10 | $180.8M10 | $187.8M9 | $50.8M8 | $78.8M8 | |
| Free cash flow | -$76.9M | -$270.8M | -$275.8M | -$153.6M | $16.7M | |
| Cash from investing | -$33.8M10 | -$175.0M10 | -$187.0M9 | -$137.7M8 | -$32.6M8 | |
| Share buybacks | $010 | $1.1M10 | ||||
| Cash from financing | $649.0M10 | $250.1M10 | $09 | $45.9M8 | $129.9M8 | |
| Dividend per share | $0.009 | $0.008 | $0.008 |
Corporate structure
T1 Energy sits at the top of its group. 16 entities, 6 countries on record. Switch between the flow chart and the network, and select any entity to see its details.
Major holders of T1 Energy
- MILLENNIUM MANAGEMENT LLC Filed SCHEDULE 13G/A on T1 Energy, latest Oct 7, 2026 (2 filings since Aug 19, 2026)
- State Street Corporation Filed SCHEDULE 13G on T1 Energy, latest Aug 7, 2026
- INTEGRATED CORE STRATEGIES (US) LLC Filed SCHEDULE 13G on T1 Energy, latest Aug 5, 2026
- BlackRock Filed SCHEDULE 13G/A on T1 Energy, latest Jul 30, 2026 (3 filings since Oct 17, 2025)
- TRINA SOLAR (SCHWEIZ) AG Filed SCHEDULE 13D/A on T1 Energy, latest May 26, 2026 (6 filings since Dec 27, 2024)
- Alussa Energy Sponsor LLC Filed SCHEDULE 13D/A on T1 Energy, latest Feb 26, 2026
- Morgan Stanley Filed SCHEDULE 13G/A on T1 Energy, latest Feb 12, 2026 (3 filings since Feb 8, 2024)
- Encompass Capital Advisors LLC Filed SCHEDULE 13D/A on T1 Energy, latest Dec 15, 2025 (7 filings since Apr 22, 2024)
- Wood River Capital, LLC Filed SCHEDULE 13D/A on T1 Energy, latest Jan 7, 2025 (3 filings since Aug 5, 2024)
- T1 Energy Austin, Texas, United States
- Alussa Energy Acquisition Corp. Subsidiary · Cayman Islands
- FREYR Battery Finland Joint Venture Oy Subsidiary · Finland
- FREYR Battery Finland Oy Subsidiary · Finland
- FREYR Battery Luxembourg S.à r.l. Subsidiary · Luxembourg
- T1 Energy Giga Arctic AS Subsidiary · Norway
- T1 Energy Holding Inc. Subsidiary · Delaware, United States
- T1 Energy Norway AS Subsidiary · Norway
- T1 Energy Norway Holding AS Subsidiary · Norway
- T1 Energy Singapore PTE. Ltd. Subsidiary · Singapore
- T1 Energy US, LLC Subsidiary · Delaware, United States
- T1 G1 Dallas Associated Entity LLC Subsidiary · Texas, United States
- T1 G1 Dallas Holding Inc. Subsidiary · Delaware, United States
- T1 G1 Dallas Midco Inc. Subsidiary · Delaware, United States
- T1 G1 Dallas Solar Module LLC Subsidiary · Texas, United States
- T1 G2 Austin Solar Cell LLC Subsidiary · Delaware, United States
Built from parent and subsidiary links from GLEIF, the Global Legal Entity Identifier Foundation (CC0); subsidiaries listed in Exhibit 21 of annual reports filed with the SEC; major holders from Schedules 13D and 13G. Each entity in the chart links to its source.
What it owns
What T1 Energy reports owning in its annual reports to the SEC: buildings, land and equipment, real estate and locations, investments, intangible assets and inventory, at the end of its latest fiscal year and a year before.
Property and equipment
| Item | Latest | A year before | Change |
|---|---|---|---|
| Machinery and equipment | $115.0M8 Dec 31, 2025 | $5.4M8 Dec 31, 2024 | +2036.9% |
| Furniture and fixtures | $7.7M8 Dec 31, 2025 | $2.7M8 Dec 31, 2024 | +186.2% |
| Leasehold improvements | $193.7M8 Dec 31, 2025 | $6.8M8 Dec 31, 2024 | +2734.6% |
| Construction in progress | $31.1M8 Dec 31, 2025 | $290.7M8 Dec 31, 2024 | −89.3% |
| Property and equipment, before depreciation | $347.4M8 Dec 31, 2025 | $305.6M8 Dec 31, 2024 | +13.7% |
| Accumulated depreciation | $45.1M8 Dec 31, 2025 | $12.0M8 Dec 31, 2024 | +276.2% |
| Property and equipment, net | $302.3M8 Dec 31, 2025 | $293.6M8 Dec 31, 2024 | +3.0% |
| Operating-lease assets (leased space) | $151.2M8 Dec 31, 2025 | $112.2M8 Dec 31, 2024 | +34.8% |
Investments
| Item | Latest | A year before | Change |
|---|---|---|---|
| Cash and cash equivalents | $182.4M8 Dec 31, 2025 | $72.6M8 Dec 31, 2024 | +151.2% |
| Stakes in other companies (equity method) | $515.0K9 Dec 31, 2024 | $1.3M9 Dec 31, 2023 | −59.6% |
Intangibles and goodwill
| Item | Latest | A year before | Change |
|---|---|---|---|
| Goodwill | $57.4M8 Dec 31, 2025 | $74.5M8 Dec 31, 2024 | −22.9% |
| Finite-lived intangibles, net | $180.5M8 Dec 31, 2025 | $283.5M8 Dec 31, 2024 | −36.3% |
Inventory
| Item | Latest | A year before | Change |
|---|---|---|---|
| Inventory, total | $116.0M8 Dec 31, 2025 | $274.5M8 Dec 31, 2024 | −57.7% |
| Raw materials | $114.6M8 Dec 31, 2025 | $253.4M8 Dec 31, 2024 | −54.8% |
| Work in process | $80.0K8 Dec 31, 2025 | $08 Dec 31, 2024 | |
| Finished goods | $154.0K8 Dec 31, 2025 | $21.1M8 Dec 31, 2024 | −99.3% |
Properties, in its own words
Our principal facilities are in the United States, and are utilized for manufacturing, selling and administrative activities, and research and development. As of December 31, 2025, in the United States, we lease manufacturing spaces in Wilmer, Texas for our G1_Dallas solar module manufacturing operations. We also lease the real property for our G2_Austin solar cell manufacturing facility in Rockdale, Texas, which is under construction. In Lysaker, Norway we lease office space for the administration of our Norwegian operations and related European assets. In Mo i Rana, Norway, we lease the CQP, which includes support facilities, and the land for Giga Arctic, and own the leasehold improvements and assets related to these leases. We lease other office spaces to support additional personnel in various jurisdictions. We believe that our facilities are suitable and adequate for the conduct of our business.
Item 2 of the 10-K filed Mar 31, 2026.7
Leadership
Who has led T1 Energy, and when. Pick a name to see everywhere that person has worked.
Chief executive
Chief financial officer
Chief operating officer
- Chief executive officerDaniel Barcelo Jan 3, 2025 to now13
- Chief executive officerBirger Steen Jan 10, 2024 to Apr 24, 202414
- Chief executive officerJan Arve Haugan1
- Chief financial officerOscar B. Brown Jan 10, 2024 to Apr 24, 202415
- Chief financial officerJoseph Evan Calio Jun 24, 2024 to now16
- Chief operating officerDavid Eric Gustafson Jan 2, 2025 to Jan 2, 202517
- Chief operating officerJaime Eduardo Gualy Aug 25, 2025 to now18
- Chief operating officerMichael Brose Aug 19, 2024 to Aug 19, 202419
Board members and other officers (26)
- OfficerThomas Mahrer Feb 13, 2026 to now20
- Chief Strategy OfficerMingxing Lin Jan 2, 2025 to now21
- OfficerDenise Cruz Mar 7, 2025 to now22
- Chief Technology OfficerAndreas Bentzen Jan 10, 2024 to now23
- Chief Human Resources OfficerJan Dahm-Simonsen Jan 10, 2024 to Jan 17, 202424
- OfficerJeremy Bezdek Jan 10, 2024 to Apr 24, 202425
- Chief Accounting OfficerLori A. Papp Jan 10, 2024 to Jan 17, 202426
- Chief Development OfficerEinar Kilde Aug 19, 2024 to now27
- Chief Sales OfficerGery Bonduelle Aug 19, 2024 to Aug 19, 202428
- Chief of StaffSonia Gilde S. Rathscheck Aug 19, 2024 to Aug 19, 202429
- Board memberRobert O. Hammond Apr 6, 2026 to now30
- Board memberSolar (schweiz) Ag Trina May 26, 2026 to now31
- Board memberMingxing Lin Jan 2, 2025 to now21
- Board memberBalazs Peter Matrai Jan 10, 2024 to now32
- Board memberBirger Steen Jan 10, 2024 to Apr 24, 202414
- Board memberDaniel Barcelo Jan 10, 2024 to now33
- Board memberDaniel Steingart Jan 10, 2024 to now34
- Board memberJason Forcier Jan 10, 2024 to Jan 10, 202435
- Board memberJessica Wirth Strine Jan 10, 2024 to now36
- Board memberTom Einar Jensen Jan 10, 2024 to May 16, 202437
- Board memberDavid J. Manners Apr 29, 2024 to now38
- Board memberTodd J. Kantor Apr 29, 2024 to now39
- Board memberTore Ivar Slettemoen Apr 29, 2024 to now40
- Board memberW. Richard Anderson Nov 14, 2024 to now41
- General counselAndrew Munro May 2, 2025 to now42
- General counselAre Brautaset Jan 10, 2024 to Jan 17, 202443
Subsidiaries and ownership
Subsidiaries (Exhibit 21)
- Alussa Energy Acquisition Corp. Cayman Islands6
- FREYR Battery Finland Joint Venture Oy Finland6
- FREYR Battery Finland Oy Finland6
- FREYR Battery Luxembourg S.à r.l. Luxembourg6
- T1 Energy Giga Arctic AS Norway6
- T1 Energy Holding Inc. Delaware6
- T1 Energy Norway AS Norway6
- T1 Energy Norway Holding AS Norway6
- T1 Energy Singapore PTE. Ltd. Singapore6
- T1 Energy US, LLC Delaware6
- T1 G1 Dallas Associated Entity LLC Texas6
- T1 G1 Dallas Holding Inc. Delaware6
- T1 G1 Dallas Midco Inc. Delaware6
- T1 G1 Dallas Solar Module LLC Texas6
- T1 G2 Austin Solar Cell LLC Delaware6
The subsidiaries the company lists in Exhibit 21 of its annual report, as filed.
Former names
- FREYR Battery, Inc. /DE/Sep 8, 2023 to Feb 14, 20255
Timeline
- Oct 6, 20268-K Other events44
- Sep 29, 20268-K Entered a material agreement; New debt or obligation; Unregistered sale of shares45
- Aug 28, 20268-K Other events46
- Aug 12, 20268-K Results of operations; Regulation FD disclosure47
- Aug 7, 20268-K Other events48
- Jul 31, 20268-K Entered a material agreement; New debt or obligation; Unregistered sale of shares49
- Jul 30, 20268-K Entered a material agreement; New debt or obligation; Unregistered sale of shares50
- Jul 28, 20268-K Entered a material agreement; Ended a material agreement; Completed an acquisition or sale51
- Jul 28, 20268-K Results of operations; Other events52
- Jun 29, 20268-K Other events53
- Jun 17, 20268-K Shareholder vote; Other events54
- Jun 8, 20268-K Unregistered sale of shares55
- Jan 3, 2025New chief executive Daniel Barcelo becomes CEO13
- Jan 10, 2024New chief executive Birger Steen becomes CEO14
- Nov 1, 2020Founded Founded1
Calendar
Coming up
- Nov 13, 2026Reports results for the quarter ending Sep/2026 A year earlier it reported ($0.85) a share, on Nov 14, 2025.56
When it reported results
- Aug 12, 2026Reported quarterly or annual results47
- Jul 28, 2026Reported quarterly or annual results52
- May 12, 2026Reported quarterly or annual results57
- Mar 31, 2026Reported quarterly or annual results58
- Nov 14, 2025Reported quarterly or annual results59
- Aug 20, 2025Reported quarterly or annual results60
- May 15, 2025Reported quarterly or annual results61
- Apr 9, 2025Reported quarterly or annual results62
Upcoming dates from Nasdaq's calendar; past results from the company's 8-K filings (Item 2.02). The full markets calendar
Filings
313 filings to the SEC since October 2021: 5 annual reports, 9 quarterly reports, 71 major events, 108 insider forms, 27 large holders, 93 other. The latest 20:
- Oct 7, 2026SCHEDULE 13G/A EDGAR
- Oct 6, 20268-K CURRENT REPORT EDGAR
- Oct 6, 2026424B7 PROSPECTUS SUPPLEMENT EDGAR
- Sep 29, 20268-K CURRENT REPORT EDGAR
- Aug 28, 20268-K CURRENT REPORT EDGAR
- Aug 28, 2026424B7 PROSPECTUS SUPPLEMENT EDGAR
- Aug 26, 20264/A PRIMARY DOCUMENT EDGAR
- Aug 19, 2026SCHEDULE 13G EDGAR
- Aug 12, 202610-Q EDGAR
- Aug 12, 20268-K CURRENT REPORT EDGAR
- Aug 7, 20268-K CURRENT REPORT EDGAR
- Aug 7, 2026424B7 PROSPECTUS SUPPLEMENT EDGAR
- Aug 7, 2026SCHEDULE 13G EDGAR
- Aug 5, 2026SCHEDULE 13G EDGAR
- Jul 31, 20268-K CURRENT REPORT EDGAR
- Jul 31, 20264 PRIMARY DOCUMENT EDGAR
- Jul 31, 20264 PRIMARY DOCUMENT EDGAR
- Jul 30, 2026SCHEDULE 13G/A EDGAR
- Jul 30, 20268-K CURRENT REPORT EDGAR
- Jul 28, 20268-K CURRENT REPORT EDGAR
The 313 filings since October 2021 can be filtered by form type and year here when JavaScript is on.
Every filing from the last five years, summarized. The full record is on SEC EDGAR.
Insider trades
16 open-market trades by officers, directors and large owners since October 2021: 4 buys and 12 sales. Grants, option exercises and gifts are left out.
| Date | Who | Trade | Shares | Price | Value | Filing |
|---|---|---|---|---|---|---|
| May 22, 2026 | TRINA SOLAR (SCHWEIZ) AG10% owner | Sale | 9,500,000 | $8.13 | $77.2M | Form 4 |
| May 21, 2026 | TRINA SOLAR (SCHWEIZ) AG10% owner | Sale | 13,000,000 | $8.69 | $113.0M | Form 4 |
| Sep 23, 2025 | Slettemoen Tore IvarDirector | Sale | 376,106 | $1.92 | $722.1K | Form 4 |
| Sep 22, 2025 | Slettemoen Tore IvarDirector | Sale | 384,349 | $1.97 | $757.2K | Form 4 |
| Sep 15, 2025 | Slettemoen Tore IvarDirector | Sale | 188,420 | $1.81 | $341.0K | Form 4 |
| Sep 11, 2025 | Slettemoen Tore IvarDirector | Sale | 26,114 | $1.97 | $51.4K | Form 4 |
| Dec 18, 2024 | Slettemoen Tore IvarDirector | Sale | 391,071 | $1.88 | $735.2K | Form 4 |
| Dec 17, 2024 | Slettemoen Tore IvarDirector | Sale | 544,588 | $1.74 | $947.6K | Form 4 |
| Dec 16, 2024 | Calio Joseph EvanChief Financial Officer | Buy | 50,000 | $1.57 | $78.5K | Form 4 |
| Dec 13, 2024 | Slettemoen Tore IvarDirector | Sale | 600,000 | $1.63 | $978.0K | Form 4 |
| Dec 13, 2024 | Calio Joseph EvanChief Financial Officer | Buy | 374,862 | $1.62 | $607.3K | Form 4 |
| Dec 12, 2024 | Calio Joseph EvanChief Financial Officer | Buy | 125,000 | $1.74 | $217.5K | Form 4 |
| Dec 12, 2024 | Slettemoen Tore IvarDirector | Sale | 184,621 | $1.67 | $308.3K | Form 4 |
| Dec 11, 2024 | Slettemoen Tore IvarDirector | Sale | 551,120 | $1.65 | $909.3K | Form 4 |
| Dec 10, 2024 | Slettemoen Tore IvarDirector | Sale | 228,600 | $1.73 | $395.5K | Form 4 |
| Nov 8, 2024 | Calio Joseph EvanChief Financial Officer | Buy | 130,600 | $1.91 | $249.4K | Form 4 |
From Forms 4 filed with the SEC.
Major holders
Investors who own more than 5% of the shares must tell the SEC: a 13D if they may seek to influence the company, a 13G if they hold passively.
- MILLENNIUM MANAGEMENT LLCSCHEDULE 13G/A, 2 filings Aug 19, 2026 to Oct 7, 202663
- State Street CorporationSCHEDULE 13G, 1 filing Aug 7, 202664
- INTEGRATED CORE STRATEGIES (US) LLCSCHEDULE 13G, 1 filing Aug 5, 202665
- BlackRockSCHEDULE 13G/A, 3 filings Oct 17, 2025 to Jul 30, 202666
- TRINA SOLAR (SCHWEIZ) AGSCHEDULE 13D/A, 6 filings Dec 27, 2024 to May 26, 202667
- Alussa Energy Sponsor LLCSCHEDULE 13D/A, 1 filing Feb 26, 202668
- Morgan StanleySCHEDULE 13G/A, 3 filings Feb 8, 2024 to Feb 12, 202669
- Encompass Capital Advisors LLCSCHEDULE 13D/A, 7 filings Apr 22, 2024 to Dec 15, 202570
- Wood River Capital, LLCSCHEDULE 13D/A, 3 filings Aug 5, 2024 to Jan 7, 202571
Executive pay
What the company paid its top executives, from the summary compensation table in its proxy statement. Total pay includes salary, bonus, stock and option awards and other pay, as the company valued them.
| Year | Executive | Age | Salary | Total pay |
|---|---|---|---|---|
| 2025 | Joseph Evan Calio | 59 | $600.0K | $7.0M72 |
| 2025 | Daniel Barcelo | 56 | $800.0K | $5.8M72 |
| 2025 | Einar GS Kilde | $550.0K | $993.4K72 | |
| 2024 | Chief Financial Officer | $327.7K | $3.2M72 | |
| 2024 | Chairman & CEO | $128.2K | $2.2M72 | |
| 2024 | Chief Development Officer | $414.7K | $592.2K72 |
SEC filer profile
How T1 Energy is registered with the Securities and Exchange Commission, from its EDGAR record and the cover page of its latest annual report.
- Name on EDGART1 Energy Inc.2
- CIK0001992243
- Employer ID (EIN)93-32058617
- Filer statusNon-accelerated filer not an emerging growth company; a smaller reporting company; not a shell company7
- Incorporated inDelaware7
- Fiscal year endsDecember 312
- Industry code (SIC)3674 Semiconductors & Related Devices2
- SEC reviewing officeOffice of Manufacturing, Division of Corporation Finance2
- Business address1211 E 4Th St., Austin, TX 787022
- Phone409-599-57062
- Shares outstanding294,527,066 as of Aug 10, 202612
- Public float$141.0M as of Jun 30, 20257
- AuditorKPMG LLP, Austin, TX PCAOB ID 185; no auditor attestation of internal control over financial reporting7
- On EDGAR sinceSep 8, 20232
- Filings314 in all: 8-K (69), 4 (67), 3 (33), CORRESP (12), SCHEDULE 13D/A (12), 10-Q (8), UPLOAD (8), 144 (7)2
All 44 form types
424B5 (7), 425 (7), EFFECT (6), FWP (6), 4/A (5), SCHEDULE 13G (5), SCHEDULE 13G/A (5), 424B7 (4), DEF 14A (4), S-3 (4), S-3/A (4), 10-K (3), 3/A (3), ARS (3), DEFA14A (3), S-4/A (3), 10-K/A (2), 424B3 (2), PRE 14A (2), S-8 POS (2), SC 13D/A (2), SCHEDULE 13D (2), 10-Q/A (1), 25-NSE (1), 305B2 (1), 8-K/A (1), 8-K12B (1), DEFR14A (1), DEL AM (1), NT 10-Q (1), POS AM (1), S-3ASR (1), S-4 (1), S-8 (1), SC 13D (1), SC 13G (1)
- Latest filingsAnnual report (10-K) Mar 31, 2026
Quarterly report (10-Q) Aug 12, 2026
Proxy statement (DEF 14A) May 18, 2026
Latest 8-K (8-K) Oct 6, 2026
Securities registered for trading
| Class | Symbol | Exchange |
|---|---|---|
| Common Stock, $0.01 par value | TE | The New York Stock Exchange |
| Warrants, each whole warrant exercisable for one Common Stock at an exercise price of $11.50 | TE WS | The New York Stock Exchange |
From the cover page of the 10-K filed Mar 31, 2026 (Section 12(b) of the Exchange Act).7
Risk factors and legal proceedings
The risks T1 Energy names in Item 1A of its 10-K filed Mar 31, 2026: 54 risks under these headings, as written.7
- Risks Relating to Operations, Development and Commercialization
- Our success depends in part on the ability to finance, construct and equip the G2_Austin manufacturing facility in a timely and cost-effective manner.
- Our planned manufacturing plants, facilities, systems, and infrastructure are subject to risks that could result in these facilities not becoming operable on schedule, or at all, or becoming damaged or destroyed, resulting in disruptions to production.
- We are subject to risks associated with leased property, as our two manufacturing facilities are leased.
- We have had a history of losses and may incur future losses, which may prevent us from attaining profitability.
- Our business is concentrated in certain markets including Texas, putting us at risk of region-specific disruptions.
- Our growth strategy depends on the widespread adoption of solar power technology.
- Several of our key raw materials and components are either single-sourced or sourced from a limited number of suppliers, and their failure to perform could cause manufacturing delays and impair our ability to deliver PV solar modules or solar cells to customers in the required quality and quantities and at prices that are profitable to us.
- The interruption of the flow of components and materials from domestic and international vendors could disrupt our supply chain, including as a result of the imposition of additional duties, tariffs and other charges on imports and exports.
- We may be unable to adequately control the costs or adjust to substantial increases in the prices for raw materials, components, equipment, and machinery.
- A drop in the price of electricity sold may harm our business, financial condition, results of operations and prospects.
- Our expected use of joint ventures and other collaborative arrangements subjects us to various risks and uncertainties.
The other 43 risks
- The loss of key customers, or the inability of our customers and counterparties to perform under their contracts with us, has and could significantly reduce our net sales and negatively impact our results of operations.
- Our corporate structure and our subsidiaries are incorporated in several jurisdictions which are subject to tax risk from local tax laws and regulations.
- Currency translation and transaction risk may negatively affect our results of operations.
- Our business relies on information technology, and any failure, inadequacy, interruption, or security lapse affecting that technology, including any cybersecurity incidents, could have a material adverse effect on our business, financial condition, and results of operations.
- We are incorporating artificial intelligence into certain of our business workflows and processes, including certain manufacturing and operational activities, and challenges with properly managing its use could result in reputational harm, competitive harm and legal liability, and adversely affect our results of operations.
- Any financial or economic crisis, or perceived threat of such a crisis, could affect our business.
- If we are unable to attract and retain key employees and qualified personnel and add significant staff, it could negatively impact our ability to operate our business and achieve our growth plans.
- Our business could be adversely affected by a failure to obtain or maintain visas or work permits or to properly verify the employment eligibility of certain employees and service providers who will provide services to G1_Dallas or G2_Austin.
- We previously identified material weaknesses in internal controls over financial reporting and determined that they resulted in our internal control over financial reporting and disclosure controls and procedures not being effective. In the future, we may identify additional deficiencies or otherwise fail to maintain an effective system of internal controls, including disclosure controls and procedures, which could result in material misstatements of our financial statements or cause us to fail to meet our reporting obligations.
- Risks Relating to Intellectual Property
- Our intellectual property rights may not provide meaningful commercial protection for our operations, manufacturing processes and products, which could have a material adverse effect on our business, financial condition and results of operations.
- We and our licensors may need to enforce intellectual property rights against third parties and defend against claims by third parties regarding intellectual property, which may be time-consuming, cause us to incur substantial costs, or result in a loss of rights, and which could have a material adverse effect on our business, financial condition and results of operations.
- Risks Relating to Industry and Market Trends and Developments
- Competition in solar markets globally and across the solar value chain is intense and could remain that way for an extended period of time. The solar industry may experience periods of structural imbalance between global PV solar modules and cells supply and demand that result in periods of pricing volatility, which could have a material adverse effect on our business, financial condition, and results of operations.
- We face intense competition from manufacturers of crystalline silicon solar modules; if global supply exceeds global demand, it could lead to a further reduction in the average selling price for PV solar modules, which could reduce our net sales and adversely affect our results of operations.
- Risks Relating to 45X Tax Credits, PFE Status and Other Tax Matters
- We expect certain financial benefits as a result of tax incentives provided by the IRA. If these expected financial benefits vary significantly from our assumptions, our business, financial condition, and results of operations could be adversely affected.
- Our transition to a T1-branded warranty framework following the FEOC Restructuring could harm our business if we fail to establish competitive warranty arrangements.
- Our ability to use net operating loss carryforwards and certain other tax attributes may be limited.
- Risks Relating to Legal and Regulatory Compliance
- Product liability claims could harm our business and liquidity if we are not able to successfully defend or insure against such claims.
- We are, and from time to time may be, involved in commercial or contractual disputes, warranty claims, and other legal proceedings, which could have an adverse impact on us.
- Claims for indemnification by our directors and officers may reduce our available funds to satisfy successful third-party claims against us and may reduce the amount of money available to us.
- We are subject to federal, state or foreign laws and regulations as well as our contractual obligations relating to privacy and data protection, and changes in laws relating to privacy and data protection could disrupt our business.
- We are subject to substantial regulation and unfavorable changes to, or failure by us to comply with, these regulations could substantially harm our business and operating results.
- Export and import controls could subject us to liability or impair our ability to compete in international markets.
- We are subject to anti-corruption, anti-bribery, anti-money laundering, financial and economic sanctions, and similar laws in many jurisdictions, and non-compliance with such laws can subject us to administrative, civil and criminal fines and penalties, collateral consequences, injunctions, disgorgement of ill-gotten gains, remedial measures, and legal expenses.
- We and our partners, suppliers, and customers are subject to requirements relating to environmental, permitting, and safety regulations as well as environmental remediation matters.
- Many of our work sites are workplaces with inherent safety and environmental risks. The occurrence of an accident or safety incident involving employees, contractors or others can result in injuries, disabilities or even loss of life, which could expose us to significant financial losses and reputational harm, as well as civil and criminal liabilities.
- We may be subject to work stoppages or other labor disturbances.
- International trade policies may impact demand for our products and our competitive position.
- The modification, reduction, elimination, or expiration of government subsidies, economic incentives, tax incentives, renewable energy targets, and other support for solar electricity applications, or the impact of other public policies, such as tariffs or other trade remedies imposed on solar cells and modules or related raw materials or equipment, or increased interest rates, could negatively impact demand and/or price levels for our solar modules and cells and limit our growth or lead to a reduction in our net sales or increase our costs, thereby adversely impacting our operating results.
- Changes in the U.S. trade environment, including the imposition of trade restrictions, import tariffs, anti-dumping and countervailing duties could adversely affect the amount or timing of our revenue, results of operations or cash flows.
- Risks Related to Indebtedness and Financing
- Our indebtedness could adversely affect our financial flexibility and our competitive position.
- Our substantial indebtedness and obligations to our preferred stockholders and Convertible Note holders could adversely affect our financial condition.
- Servicing our debt and obligations to our preferred stockholders requires a significant amount of cash, and we may not have sufficient cash flow from our business to pay our substantial debt and obligations to our preferred stockholders.
- Our business plan is capital-intensive, and we may not be able to raise additional capital on attractive terms, if at all, which could materially adversely affect our ability to operate our business and execute our growth plans. If we do raise additional capital, through debt or equity financing, this could impose additional restrictions on our operations and/or have a dilutive effect on current stockholders.
- We may not be able to raise additional capital to execute our current or future business strategies on favorable terms, if at all, or without dilution to our stockholders.
- Despite our current debt levels, we may still incur substantially more debt or take other actions which would intensify the risks discussed above.
- Risks Relating to Ownership of our Common Stock
- The concentration of ownership among our executive officers, directors, and their affiliates may prevent new investors from influencing significant corporate decisions.
- The market price of our common stock is likely to be highly volatile, and you may lose some or all of your investment.
- If securities or industry analysts do not publish research or publish inaccurate or unfavorable research about our business, or if third-party commentary about our company is negative or ceases, our share price and trading volume could decline.
- Future offerings of debt, which would be senior to our common stock upon liquidation, and/or preferred equity securities, which may be senior to our common stock for purposes of dividend distributions or upon liquidation, may adversely affect the market price of our common stock.
- Future sales of our common stock or equity-linked securities in the public market could lower the trading price of our common stock.
- We do not expect to declare dividends on our common stock in the foreseeable future.
- We may call certain of our unexpired warrants prior to their exercise at a time that is disadvantageous to warrant holders, thereby making their warrants worthless, and the exercise of a significant number of the warrants could adversely affect the market price of our common stock.
- There can be no assurance that we will be able to continue to comply with the continued listing standards of the NYSE.
Legal proceedings
From time to time, we may be involved in litigation relating to claims arising in the ordinary course of our business. To the knowledge of our management, there are no material litigation, claims, or actions currently pending or threatened against us, any of our officers, or directors in their capacity as such, or against any of our property, except as described below.
On June 5, 2025 and July 31, 2025, we received notices from U.S. Customs and Border Protection (“CBP”) relating to potential customs duties on goods imported in 2024 by one of the entities we acquired in the Trina Business Combination (the “Notices”). We have engaged with CBP on these Notices and explained why we believe they were without legal or factual merit. In March 2026, we received bills from CBP for alleged antidumping duties on goods imported in 2024 by the same entity acquired in the Trina Business Combination. It is unclear what, if any, connection these bills have with the Notices previously received. At this point, the bills received total approximately $25.4 million. The Company is engaging with CBP, through outside counsel, to correct what it believes is the erroneous application of duties, but it is not possible at this time to predict the duration, outcome, or impact of these matters, which the Company maintains would ultimately be subject to indemnification pursuant to the Trina Business Combination.
The opening of Item 3, Legal Proceedings.7
Links
- Websitet1energy.com1
- WikidataQ120761341
- SEC EDGARCIK 1992243
Sources
The numbers on this page point here. Each one links to the record it came from.
- 1WikidataT1 Energy on Wikidata
- 2SEC EDGART1 Energy filings on SEC EDGAR
- 3
- 4Company websiteT1 Energy logo
- 5SEC EDGART1 Energy filings on SEC EDGAR
- 6
- 7
- 8SEC EDGART1 Energy 10-K for fiscal 2025
- 9SEC EDGART1 Energy 10-K for fiscal 2023
- 10SEC EDGART1 Energy 10-K for fiscal 2021
- 11SEC EDGART1 Energy 10-Q for fiscal 2026
- 12SEC EDGART1 Energy 10-Q for fiscal 2026
- 13
- 14
- 15
- 16
- 17
- 18
- 19
- 20SEC EDGARThomas Mahrer, Officer
- 21SEC EDGARMingxing Lin, Chief Strategy Officer
- 22SEC EDGARDenise Cruz, Officer
- 23
- 24
- 25SEC EDGARJeremy Bezdek, Officer
- 26
- 27
- 28SEC EDGARGery Bonduelle, Chief Sales Officer
- 29
- 30SEC EDGARRobert O. Hammond, Board member
- 31
- 32SEC EDGARBalazs Peter Matrai, Board member
- 33SEC EDGARDaniel Barcelo, Board member
- 34SEC EDGARDaniel Steingart, Board member
- 35SEC EDGARJason Forcier, Board member
- 36SEC EDGARJessica Wirth Strine, Board member
- 37SEC EDGARTom Einar Jensen, Board member
- 38SEC EDGARDavid J. Manners, Board member
- 39SEC EDGARTodd J. Kantor, Board member
- 40SEC EDGARTore Ivar Slettemoen, Board member
- 41SEC EDGARW. Richard Anderson, Board member
- 42SEC EDGARAndrew Munro, General counsel
- 43SEC EDGARAre Brautaset, General counsel
- 44SEC EDGAROther events
- 45
- 46SEC EDGAROther events
- 47
- 48SEC EDGAROther events
- 49
- 50
- 51
- 52SEC EDGARResults of operations; Other events
- 53SEC EDGAROther events
- 54SEC EDGARShareholder vote; Other events
- 55SEC EDGARUnregistered sale of shares
- 56NasdaqNasdaq calendar
- 57
- 58
- 59
- 60
- 61
- 62
- 63
- 64
- 65
- 66
- 67
- 68
- 69
- 70
- 71
- 72