

Overview
Compare with Niu Technologies, XPeng or The Lion Electric Co., or pick any stock.
- TickerLOT on Nasdaq1
- IndustryMotor Vehicles & Passenger Car Bodies1
- HeadquartersWest Perth1
- Websitelotusresources.com.au
- Incorporated inCayman Islands5
- Business addressNo. 800 Century Avenue, Pudong District, Shanghai5
- Filer categoryNon-accelerated filer, Emerging growth company5
- Legal formCorporation
See how the biggest companies compare on our leaderboards
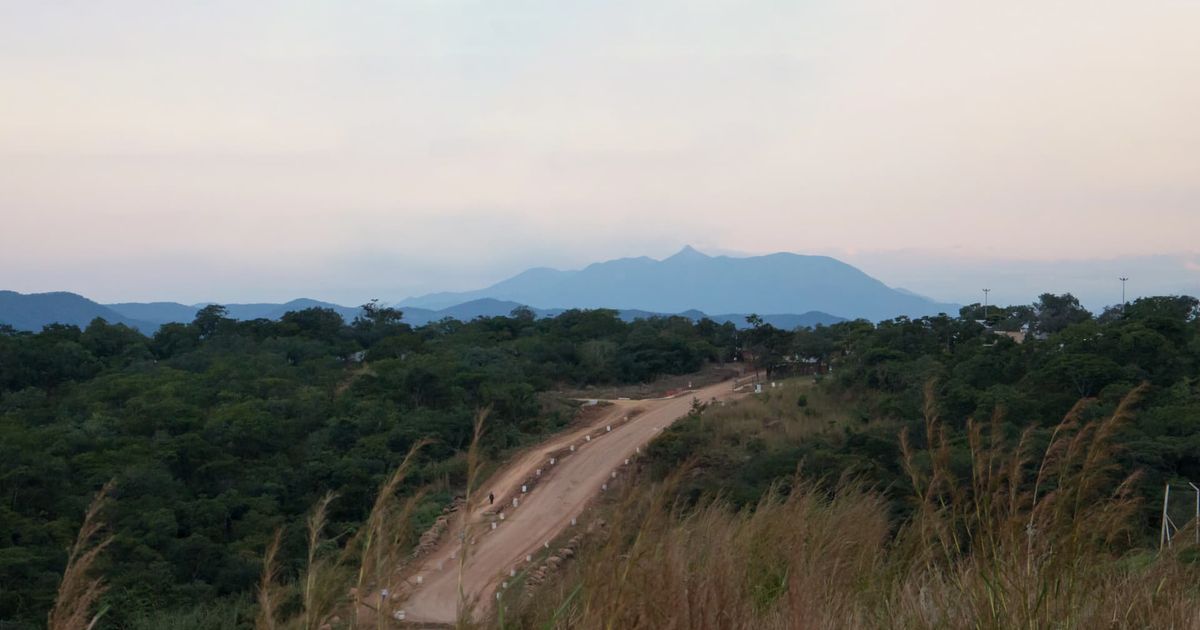
Our Lotus EV business, founded in 2018, was carried out by Wuhan Lotus Cars and the Lotus EV business unit of Ningbo Geely Automobile Research & Development Co., Ltd., or Ningbo Geely R&D, incorporated in the People’s Republic of China, Lotus Tech UK incorporated in the U.K. and Lotus Tech Innovation Centre GmbH, or Lotus GmbH, incorporated in Germany. For the periods ended prior to the Restructuring, we also carried out the Lotus EV business through the former VIE and its subsidiaries based in mainland China. However, we restructured our company beginning in 2023 such that we no longer have any VIE. We refer to this series of transactions in this annual report as the Restructuring.6 From its latest annual report
Financials
From the company’s reports to the SEC. Every number links to the filing it came from.
Key numbers, fiscal 2025
What sells
Revenue by product, business segment and region, as the company reports it to the SEC.
Products and services
Product brought in 89% of the revenue Lotus Resources Limited broke down this way in fiscal 2025.
Products and services by year
| Products and services | 2023 | 2024 | 2025 |
|---|---|---|---|
| Product | $660.2M | $891.1M | $462.8M |
| Service | $18.9M | $33.3M | $56.3M |
Regions
China brought in 51% of the revenue Lotus Resources Limited broke down this way in fiscal 2025.
Regions by year
| Regions | 2023 | 2024 | 2025 |
|---|---|---|---|
| China | $419.4M | $314.4M | $262.8M |
| European Union | $97.2M | $209.7M | $112.0M |
| United Kingdoms | $83.8M | $208.3M | $102.9M |
| Others | $78.5M | $192.0M | $41.4M |
Where the money goes
Where each dollar of revenue went, fiscal 2025
- Cost of revenue65¢$473.9M
- Research and development24¢$171.0M
- Interest9¢$63.3M
- Income tax2¢$15.9M
Out of $519.1M in revenue.4 The company lost money this year.
Financial statements
No quarterly figures reported.
Every line of the income statement as filed: the last 3 fiscal years, latest first.4
| Period ending | 2025-12-31 | 2024-12-31 | 2023-12-31 |
|---|---|---|---|
| Total cost of revenues | -$473.9M | -$894.7M | -$576.8M |
| Gross profit | $45.2M | $29.6M | $102.2M |
| Research and development expenses (including related parties amounts of US$63,011, US$107,669 and US$135,334 for the years ended December 31, 2025, 2024 and 2023, respectively) | -$171.0M | -$274.8M | -$368.7M |
| Selling and marketing expenses (including related parties amounts of US$20,125, US$52,636 and US$40,531 for the years ended December 31, 2025, 2024 and 2023, respectively) | -$148.3M | -$322.3M | -$328.9M |
| General and administrative expenses (including related parties amounts of US$4,227, US$10,873 and US$13,085 for the years ended December 31, 2025, 2024 and 2023, respectively) | -$135.8M | -$227.5M | -$144.5M |
| Other operating income | $38.5M | $8.6M | $4.1M |
| Impairment of long-lived assets | -$51.8M | $0 | $0 |
| Total operating expenses | -$468.4M | -$815.9M | -$838.1M |
| Operating loss | -$423.2M | -$786.3M | -$735.9M |
| Interest income (including related parties amounts of US$20,725, US$13,661 and US$122 for the years ended December 31, 2025, 2024 and 2023, respectively) | $28.1M | $22.3M | $9.2M |
| Investment income (loss), net | $10.7M | $14.2M | -$1.2M |
| Foreign currency exchange gains (losses), net | $25.7M | -$11.7M | $42.0K |
| Changes in fair values of liabilities, excluding impact of instrument-specific credit risk | -$28.3M | -$285.4M | -$10.0M |
| Loss before income taxes and share of results of equity method investments | -$450.3M | -$1.1B | -$748.1M |
| Income tax expense | -$15.9M | -$2.0M | -$1.1M |
| Share of results of equity method investments | $2.0M | -$171.0K | -$1.0M |
| Net loss | -$464.2M | -$1.1B | -$750.3M |
| Less: Net loss attributable to noncontrolling interests | -$2.0K | -$2.4M | -$8.3M |
| Net loss attributable to ordinary shareholders | -$464.2M | -$1.1B | -$742.0M |
| Accretion of redeemable convertible preferred shares | $0 | -$3.0M | -$15.1M |
| Net loss available to ordinary shareholders | -$464.2M | -$1.1B | -$757.1M |
| Loss per ordinary share - Basic | -$0.72 | -$1.72 | -$1.60 |
| Loss per ordinary share - Diluted | -$0.72 | -$1.72 | -$1.60 |
| Weighted average number of ordinary shares outstanding used in computing net loss per ordinary share - Basic | 648.5M shares | 645.2M shares | 474.6M shares |
| Weighted average number of ordinary shares outstanding used in computing net loss per ordinary share - Diluted | 648.5M shares | 645.2M shares | 474.6M shares |
| Fair value changes of liabilities due to instrument-specific credit risk, net of nil income taxes | $13.9M | $13.5M | -$8.7M |
| Foreign currency translation adjustment, net of nil income taxes | -$29.2M | $16.4M | $16.2M |
| Total other comprehensive (loss) income | -$15.3M | $29.9M | $7.6M |
| Total comprehensive loss | -$479.6M | -$1.1B | -$742.7M |
| Less: Total comprehensive loss attributable to noncontrolling interests | -$2.0K | -$2.4M | -$8.3M |
| Total comprehensive loss attributable to ordinary shareholders | -$479.6M | -$1.1B | -$734.4M |
| Total revenues | $519.1M | $924.3M | $679.0M |
| Fair value changes of liabilities due to instrument-specific credit risk, income taxes | $0 | $0 | $0 |
| Foreign currency translation adjustment, income taxes | $0 | $0 | $0 |
| Interest expenses (including related parties amounts of US$39,109, US$19,504 and nil for the years ended December 31, 2025, 2024 and 2023, respectively) | $63.3M | $58.2M | $10.2M |
| Net of income taxes | $0 | $0 | $0 |
No quarter-by-quarter statement was filed.
No quarterly figures reported.
Every line of the balance sheet as filed: the last 5 fiscal years (annual) or 5 quarters (quarterly), latest first.4
| Period ending | 2025-12-31 | 2024-12-31 | 2024-02-29 | 2023-12-31 | 2022-12-31 |
|---|---|---|---|---|---|
| Cash and cash equivalents | $73.4M | $103.1M | $418.9M | ||
| Restricted cash | $375.9M | $379.3M | $7.9M | ||
| Inventories | $121.4M | $188.6M | |||
| Total current assets | $911.1M | $1.0B | |||
| Restricted cash | $101.0M | $2.6M | $321.0K | ||
| Securities pledged to an investor | $0 | $315.8M | |||
| Loan receivable from a related party | $351.5M | $269.5M | |||
| Property, equipment and software, net | $226.9M | $316.4M | |||
| Intangible assets | $116.5M | $116.5M | |||
| Long-term investments | $48.0M | $9.7M | |||
| Operating lease right-of-use assets | $118.8M | $144.0M | |||
| Total non-current assets | $1.0B | $1.2B | |||
| Total assets | $2.0B | $2.3B | |||
| Shortterm borrowings | $1.3B | $802.5M | |||
| Share buyback forward liabilities | $0 | $117.1M | |||
| Put option liabilities - third parties | $0 | $309.1M | |||
| Total current liabilities | $2.4B | $2.5B | |||
| Contract liabilities - third parties | $7.5M | $8.7M | |||
| Warrant liabilities | $800.0K | $3.3M | |||
| Exchangeable notes | $128.9M | $103.0M | |||
| Long-term borrowings | $98.3M | $0 | |||
| Deferred income | $311.9M | $293.9M | |||
| Deferred tax liabilities | $698.0K | $0 | |||
| Total noncurrent liabilities | $884.9M | $678.5M | |||
| Total liabilities | $3.3B | $3.1B | |||
| Ordinary shares (US$0.00001 par value per share, 5,000,000,000 shares authorized as of December 31, 2025 and 2024; 707,196,733 and 694,134,038 shares issued as of December 31, 2025 and 2024, respectively; 640,672,331 and 676,826,794 shares outstanding as of December 31, 2025 and 2024, respectively) | $7.0K | $7.0K | |||
| Treasury stock | -$138.4M | $0 | |||
| Additional paid-in capital | $1.9B | $1.8B | |||
| Accumulated other comprehensive income | $39.8M | $55.2M | |||
| Accumulated deficit | -$3.2B | -$2.7B | |||
| Total shareholders' deficit attributable to ordinary shareholders | -$1.3B | -$852.9M | |||
| Noncontrolling interests | -$7.7M | -$7.4M | |||
| Total shareholders' deficit | -$1.3B | -$860.2M | -$1.2B | -$453.0M | |
| Total liabilities and shareholders' deficit | $2.0B | $2.3B | |||
| Common shares, par value (in dollars per share) | $0.00 | $0.00 | $0.00 | ||
| Common shares, shares authorized | 5.0B shares | 5.0B shares | 5.0B shares | ||
| Common shares, shares issued | 707.2M shares | 694.1M shares | |||
| Common shares, shares outstanding | 640.7M shares | 676.8M shares |
Cash flow is reported year to date, not quarter by quarter, so there are no separate quarterly figures.
Every line of the cash flow as filed: the last 3 fiscal years, latest first.4
| Period ending | 2025-12-31 | 2024-12-31 | 2023-12-31 |
|---|---|---|---|
| Net loss | -$464.2M | -$1.1B | -$750.3M |
| Depreciation | $54.7M | $76.5M | $55.0M |
| Reduction in the carrying amount of operating lease right-of-use assets | $14.1M | $18.3M | $20.1M |
| Investment (income) loss, net | -$10.7M | -$14.2M | $1.2M |
| Share of results of equity method investments | -$2.0M | $171.0K | $1.0M |
| Changes in fair values of liabilities, excluding impact of instrument-specific credit risk | $28.3M | $285.4M | $10.0M |
| Share-based compensation expense | $2.3M | $31.9M | |
| Deferred income tax expense | $687.0K | -$126.0K | |
| Non-cash interest expenses | $12.9M | $14.8M | $1.6M |
| Non-cash interest income | -$21.2M | -$13.4M | |
| Amortization of deferred income relating to government grants | -$60.0K | -$25.0K | |
| Expected credit loss (reversal) accrual | -$4.8M | $5.8M | $389.0K |
| Warranty expenses | $21.0M | $21.9M | $8.5M |
| Commission fee for Westwood subscription commitment | $3.5M | ||
| Impairment of long-lived assets | $51.8M | $0 | $0 |
| Non-cash other operating income | -$33.0M | ||
| Net unrealized foreign currency exchange losses | $1.6M | $496.0K | $1.5M |
| Inventories | $81.2M | $69.7M | -$235.1M |
| Operating lease liabilities | -$17.1M | -$16.4M | -$29.4M |
| Net cash used in operating activities | -$333.9M | -$848.5M | -$386.9M |
| Payments for purchases of property, equipment and software and intangible assets | -$79.4M | -$57.3M | -$213.7M |
| Proceeds from disposal of property, equipment and software | $20.2M | $6.5M | $5.1M |
| Payments for purchases of short-term investments | -$48.1M | -$38.3M | |
| Proceeds from sales of short-term investments | $48.3M | $37.4M | |
| Proceeds from settlement of derivative instruments | $740.0K | $239.0K | |
| Receipts of government grants related to assets | $11.3M | $28.1M | $16.3M |
| Payments for investments in equity investees | -$414.0K | -$5.1M | |
| Disposal of a subsidiary, net of cash disposed | -$371.0K | $6.8M | $1.4M |
| Payments for purchases of securities pledged to an investor | -$500.0M | ||
| Proceeds from sales of securities pledged to an investor | $326.9M | $189.6M | |
| Proceeds from investment income arising from securities pledged to an investor | $8.9M | ||
| Loans to related parties | -$60.7M | -$262.2M | -$1.2M |
| Proceed from settlement of related party loans | $140.0K | ||
| Disposal of equity investment under common control | $58.9M | ||
| Net cash provided by (used in) investing activities | $277.6M | -$579.4M | -$198.0M |
| Payments of cash collateral to Meritz | -$76.5M | ||
| Payment for settlement of Meritz | -$512.9M | ||
| Payment for redemption of exchangeable notes | -$366.0M | ||
| Proceeds from issuance of ordinary shares to exchangeable notes holders | $361.3M | ||
| Proceeds from issuance of exchangeable notes | $27.8M | $28.5M | $27.9M |
| Proceeds from exercise of public warrant | $5.7M | ||
| Proceeds from settlement of receivable from shareholders | $26.1M | ||
| Proceeds from issuance of convertible notes | $199.3M | $119.3M | $25.3M |
| Repayment of mandatorily redeemable noncontrolling interest | -$11.6M | ||
| Repayments of refundable deposits in connection with PIPE investments | -$10.3M | ||
| Payment for redemption of convertible notes | -$119.3M | -$5.6M | |
| Receipts of refundable deposits in connection with PIPE investments | $10.0M | ||
| Capital contributions by noncontrolling interests | $404.0K | $4.5M | |
| Proceeds from borrowings | $1.4B | $1.0B | $481.2M |
| Repayments of borrowings | -$889.5M | -$460.9M | -$272.9M |
| Payments to a noncontrolling interest in the liquidation of a subsidiary | -$148.0K | ||
| Net cash provided by financing activities | $128.5M | $1.5B | $284.7M |
| Effect of exchange rate changes on cash, cash equivalents and restricted cash | -$6.8M | $26.2M | -$12.2M |
| Net increase (decrease) in cash, cash equivalents and restricted cash | $65.3M | $57.8M | -$312.4M |
| Interest paid | $19.2M | $8.1M | $8.1M |
| Income taxes paid | $16.5M | $678.0K | $1.2M |
| Income taxes refund | -$349.0K | -$127.0K | -$45.0K |
| Purchase of property, equipment and software and intangible assets included in accrued expenses and other current liabilities | $25.4M | $70.9M | $71.1M |
| Accretion of redeemable convertible preferred shares | $3.0M | $15.1M | |
| Issuance of ordinary shares through conversion of redeemable convertible preferred shares | $386.5M | ||
| Payable arising from a distribution agreement | $22.3M | ||
| Issuance of put option liabilities | $9.4M | ||
| Payable arising from deferred listing expenses | $1.6M | ||
| Issuance costs payable | $6.6M | $6.6M | |
| Issuance of ordinary shares through conversion of convertible notes | $1.2M | $30.1M | |
| Acquire equity interest through licensing certain internally developed intellectual property | $35.6M |
No quarter-by-quarter statement was filed.
Corporate structure
Lotus Resources Limited sits at the top of its group. 1 entity, 1 country on record. Switch between the flow chart and the network, and select any entity to see its details.
Major holders of Lotus Resources Limited
- Automotive Sdn Bhd Etika Filed SCHEDULE 13D on Lotus Resources Limited, latest Jun 24, 2026 (2 filings since Nov 8, 2024)
- Eric Li Filed SCHEDULE 13D/A on Lotus Resources Limited, latest Jun 12, 2026 (2 filings since Feb 13, 2026)
- ATW Partners Opportunities Management, LLC Filed SCHEDULE 13G on Lotus Resources Limited, latest Oct 3, 2025
- Meritz Securities Co., Ltd. Filed SCHEDULE 13G/A on Lotus Resources Limited, latest Oct 1, 2025 (2 filings since May 13, 2024)
- Lotus Advanced Technology Limited Partnership Filed SC 13G on Lotus Resources Limited, latest Nov 12, 2024
- Lotus Resources Limited West Perth
Built from major holders from Schedules 13D and 13G. Each entity in the chart links to its source.
What it owns
What Lotus Resources Limited reports owning in its annual reports to the SEC: buildings, land and equipment, real estate and locations, investments, intangible assets and inventory, at the end of its latest fiscal year and a year before.
Property and equipment
| Item | Latest | A year before | Change |
|---|---|---|---|
| Property and equipment, before depreciation | $316.1M4 Dec 31, 2025 | $372.3M4 Dec 31, 2024 | −15.1% |
| Accumulated depreciation | $156.7M4 Dec 31, 2025 | $122.9M4 Dec 31, 2024 | +27.5% |
| Property and equipment, net | $226.9M4 Dec 31, 2025 | $316.4M4 Dec 31, 2024 | −28.3% |
| Operating-lease assets (leased space) | $118.8M4 Dec 31, 2025 | $144.0M4 Dec 31, 2024 | −17.5% |
Investments
| Item | Latest | A year before | Change |
|---|---|---|---|
| Cash and cash equivalents | $73.4M4 Dec 31, 2025 | $103.1M4 Dec 31, 2024 | −28.8% |
| Marketable securities, non-current | $2.2M8 Dec 31, 2024 | $3.3M7 Dec 31, 2023 | −33.2% |
| Stakes in other companies (equity method) | $7.5M8 Dec 31, 2024 | $4.5M8 Dec 31, 2023 | +67.9% |
| Long-term investments | $48.0M4 Dec 31, 2025 | $9.7M4 Dec 31, 2024 | +393.9% |
Intangibles and goodwill
| Item | Latest | A year before | Change |
|---|---|---|---|
| Intangible assets, net (excluding goodwill) | $116.5M4 Dec 31, 2025 | $116.5M4 Dec 31, 2024 | 0% |
| Trademarks and trade names (indefinite-lived) | $116.1M4 Dec 31, 2025 | $116.1M4 Dec 31, 2024 | 0% |
Inventory
Leadership
Who has led Lotus Resources Limited, and when. Pick a name to see everywhere that person has worked.
- Chief executive officerQingfeng Feng Mar 26, 2026 to now9
- Chief financial officerDaxue Wang Mar 16, 2026 to now10
Board members and other officers (5)
- Board memberYunfeng Yan Feb 26, 2026 to now11
- Board memberAmrin Bin Awaluddin Mr. Mar 18, 2026 to now12
- Board memberCatherine Hongjun Cai Mar 18, 2026 to now13
- Board memberQingfeng Feng Mar 26, 2026 to now9
- Board memberNing Nathan Yu Apr 29, 2026 to now14
Named in SEC Form D filings
People the company listed in its private-offering notices.
Timeline
Calendar
Coming up
- Nov 23, 2026Reports results for the quarter ending Sep/2026 A year earlier it reported ($0.10) a share, on Nov 24, 2025.16
Upcoming dates from Nasdaq's calendar; past results from the company's 8-K filings (Item 2.02). The full markets calendar
Filings
182 filings to the SEC since October 2021: 3 annual reports, 9 insider forms, 8 large holders, 1 private raises, 161 other. The latest 20:
- Sep 14, 20266-K EDGAR
- Aug 27, 20266-K EDGAR
- Aug 25, 20266-K EDGAR
- Jun 24, 2026SCHEDULE 13D EDGAR
- Jun 15, 20266-K EDGAR
- Jun 12, 2026SCHEDULE 13D/A EDGAR
- Jun 12, 20266-K EDGAR
- Jun 11, 20263 OWNERSHIP DOCUMENT EDGAR
- Jun 3, 20266-K EDGAR
- May 12, 20266-K EDGAR
- Apr 29, 20263 OWNERSHIP DOCUMENT EDGAR
- Apr 28, 202620-F EDGAR
- Apr 13, 20263 OWNERSHIP DOCUMENT EDGAR
- Apr 10, 20266-K EDGAR
- Mar 30, 20266-K EDGAR
- Mar 27, 20263 OWNERSHIP DOCUMENT EDGAR
- Mar 26, 20263 OWNERSHIP DOCUMENT EDGAR
- Mar 18, 20263 PRIMARY DOCUMENT EDGAR
- Mar 18, 20263 OWNERSHIP DOCUMENT EDGAR
- Mar 16, 20263 OWNERSHIP DOCUMENT EDGAR
The 182 filings since October 2021 can be filtered by form type and year here when JavaScript is on.
Every filing from the last five years, summarized. The full record is on SEC EDGAR.
Major holders
Investors who own more than 5% of the shares must tell the SEC: a 13D if they may seek to influence the company, a 13G if they hold passively.
- Automotive Sdn Bhd EtikaSCHEDULE 13D, 2 filings Nov 8, 2024 to Jun 24, 202617
- Eric LiSCHEDULE 13D/A, 2 filings Feb 13, 2026 to Jun 12, 202618
- ATW Partners Opportunities Management, LLCSCHEDULE 13G, 1 filing Oct 3, 202519
- Meritz Securities Co., Ltd.SCHEDULE 13G/A, 2 filings May 13, 2024 to Oct 1, 202520
- Lotus Advanced Technology Limited PartnershipSC 13G, 1 filing Nov 12, 202421
Money raised
Private offerings the company reported to the SEC on Form D.
- Sep 30, 2024Filed a private offering of equity Form D: $350 million offered in all Form D
Held by these funds
The largest holders among investment managers' 13F reports for the quarter ending Jun 30, 2026. Change is in shares since the quarter before.
| Fund | Shares | Value | Share of the fund | Change |
|---|---|---|---|---|
| HSG Holding Ltd | 4,834,099 | $5.7M | 0.5% | No change |
| Citadel Advisors LLC | 105,517 | $123.5K | 0.0% | +62,630 |
| State Street Corp | 52,332 | $61.2K | 0.0% | −3,617 |
| Morgan Stanley | 32,562 | $38.1K | 0.0% | −11,735 |
| Tidal Investments LLC | 28,799 | $33.7K | 0.0% | +2,086 |
| Jane Street Group, LLC | 24,975 | $29.2K | 0.0% | New |
| XTX Topco Ltd | 24,595 | $28.8K | 0.0% | −9,025 |
| UBS Group AG | 15,883 | $18.6K | 0.0% | +3,497 |
| Two Sigma Securities, LLC | 15,217 | $17.8K | 0.0% | +574 |
| SBI Securities Co., Ltd. | 231 | $270 | 0.0% | +100 |
| Quarry LP | 210 | $246 | 0.0% | New |
| Virtu Financial LLC | 12,121 | $14 | 0.0% | −9,376 |
| Caitong International Asset Management Co., Ltd | 4 | $5 | 0.0% | +2 |
13F reports cover disclosed long positions in U.S. stocks only.
SEC filer profile
How Lotus Resources Limited is registered with the Securities and Exchange Commission, from its EDGAR record and the cover page of its latest annual report.
- Name on EDGARLotus Technology Inc.2
- CIK0001962746
- Filer statusNon-accelerated filer an emerging growth company; not a shell company6
- Incorporated inCayman Islands6
- Fiscal year endsDecember 312
- Industry code (SIC)3711 Motor Vehicles & Passenger Car Bodies2
- SEC reviewing officeOffice of Manufacturing, Division of Corporation Finance2
- Business addressNo. 800 Century Avenue, Pudong District, Shanghai, China2
- Phone86 27 849901992
- Shares outstanding642,089,875 shares as of Dec 31, 20256
- AuditorGrant Thornton Zhitong Certified Public Accountants LLP, Shanghai, China PCAOB ID 1487; no auditor attestation of internal control over financial reporting6
- On EDGAR sinceJan 31, 20232
- Filings182 in all: 6-K (49), 424B3 (32), 425 (21), UPLOAD (12), CORRESP (11), 3 (9), EFFECT (8), POS AM (5)2
All 30 form types
DRSLTR (4), 20-F (3), F-4/A (3), SC 13G (3), DRS (2), DRS/A (2), F-1 (2), SCHEDULE 13D (2), 305B2 (1), 424B5 (1), 8-A12B (1), CERT (1), D (1), F-3 (1), F-3/A (1), F-4 (1), F-6 (1), F-6EF (1), S-8 (1), SCHEDULE 13D/A (1), SCHEDULE 13G (1), SCHEDULE 13G/A (1)
- Latest filingsAnnual report (20-F) Apr 28, 2026
Securities registered for trading
| Class | Symbol | Exchange |
|---|---|---|
| American depositary shares (each representing one ordinary share, par value US$0.00001 per share) | LOT | Nasdaq |
| Warrants | LOTWW | Nasdaq |
From the cover page of the 20-F filed Apr 28, 2026 (Section 12(b) of the Exchange Act).6
Links
- Websitelotusresources.com.au1
- WikidataQ106441604
- SEC EDGARCIK 1962746
Sources
The numbers on this page point here. Each one links to the record it came from.
- 1
- 2
- 3Company websiteLotus Resources Limited logo
- 4
- 5
- 6
- 7
- 8
- 9
- 10SEC EDGARDaxue Wang, Chief financial officer
- 11SEC EDGARYunfeng Yan, Board member
- 12
- 13SEC EDGARCatherine Hongjun Cai, Board member
- 14SEC EDGARNing Nathan Yu, Board member
- 15
- 16NasdaqNasdaq calendar
- 17
- 18
- 19
- 20
- 21