
LOVE on Nasdaq

LoveSac

American furniture retailer

The Lovesac Company is an American furniture retailer, specializing in a patented modular furniture system called Sactionals. Sactionals consist of two combinable pieces, “Seats” and “Sides,” as well as custom-fit covers and associated accessories.3 From Wikipedia, CC BY-SA 4.0

Price unavailable

Last updated Oct 18, 2026.

Overview

$697.1MRevenue, fiscal 20264
$4.1MNet income, fiscal 20264
1995Founded1

Compare with Havertys, HomesToLife Ltd or Arhaus, Inc., or pick any stock.

  • TickerLOVE on Nasdaq1
  • IndustryRetail-Furniture Stores1
  • HeadquartersStamford1
  • Websitewww.lovesac.com
  • Legal formcompany1
  • Incorporated inDE5
  • Business address421 Atlantic Street, Suite 200, Stamford, Ct5
  • Filer categoryAccelerated filer5
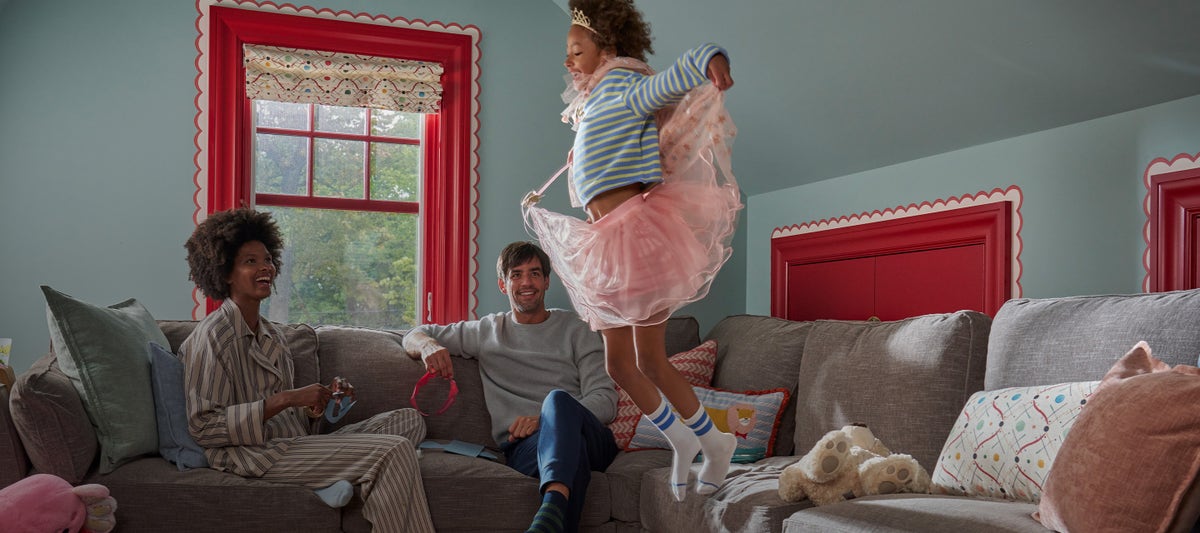
LoveSac image from its website
Image: lovesac.com7

The Lovesac Company is an American furniture retailer, specializing in a patented modular furniture system called Sactionals. Sactionals consist of two combinable pieces, “Seats” and “Sides,” as well as custom-fit covers and associated accessories. Lovesac also sells Sacs, a bag seat filled with a proprietary foam mixture.3

Financials

From the company’s reports to the SEC. Every number links to the filing it came from.

Key numbers, fiscal 2026

56.4%Gross margin4
0.8%Operating margin4
0.6%Net margin4
2.4%Revenue growth, 20264
1.9%Return on equity4
$26.2MFree cash flow4

What sells

Revenue by product, business segment and region, as the company reports it to the SEC.

Business segments

Sactionals brought in 91% of the revenue LoveSac broke down this way in fiscal 2026.

  1. Sactionals$634.8M491%up 2% from 2025
  2. Sacs$42.6M46%down 13% from 2025
  3. Other Operating$19.7M43%up 99% from 2025
Business segments by year
Business segments202420252026
Sactionals$637.4M$621.9M$634.8M
Sacs$51.7M$48.8M$42.6M
Other Operating$11.2M$9.9M$19.7M

Where the money goes

Where each dollar of revenue went, fiscal 2026

  • Cost of revenue44¢$303.9M
  • Research and development1¢$7.0M
  • Selling, general and admin41¢$284.0M
  • Other costs14¢$95.6M
  • Income tax0¢$2.6M
  • Profit1¢$4.1M

Out of $697.1M in revenue.4

Where each dollar of operating cash went, fiscal 2026

  • Capital spending47¢$23.1M
  • Share buybacks12¢$6.0M
  • Kept or used elsewhere41¢$20.2M

Out of $49.3M of cash from operations.4

Financial statements

Revenue891011124$697.1M in 2026+320% since 2019
0$200.0M$400.0M$600.0M$800.0M2019: $165.9M$165.9M20192020: $233.4M$233.4M2020+41%2021: $320.7M$320.7M2021+37%2022: $498.2M$498.2M2022+55%2023: $651.2M$651.2M2023+31%2024: $700.3M$700.3M2024+8%2025: $680.6M$680.6M2025−3%2026: $697.1M$697.1M2026+2%
Gross profit891011124$393.2M in 2026+333% since 2019
0$200.0M$400.0M$600.0M2019: $90.9M$90.9M20192020: $116.7M$116.7M2020+28%2021: $174.8M$174.8M2021+50%2022: $273.5M$273.5M2022+57%2023: $343.7M$343.7M2023+26%2024: $401.0M$401.0M2024+17%2025: $397.8M$397.8M2025−1%2026: $393.2M$393.2M2026−1%
Operating income891011124$5.4M in 2026
-$20.0M0$20.0M$40.0M$60.0M2019: -$7.0M-$7.0M20192020: -$15.8M-$15.8M2020+124%2021: $14.9M$14.9M20212022: $40.6M$40.6M2022+173%2023: $37.0M$37.0M2023−9%2024: $30.1M$30.1M2024−19%2025: $13.6M$13.6M2025−55%2026: $5.4M$5.4M2026−61%
Net income891011124$4.1M in 2026
-$20.0M0$20.0M$40.0M$60.0M2019: -$6.7M-$6.7M20192020: -$15.2M-$15.2M2020+127%2021: $14.7M$14.7M20212022: $47.5M$47.5M2022+222%2023: $26.5M$26.5M2023−44%2024: $23.9M$23.9M2024−10%2025: $11.6M$11.6M2025−52%2026: $4.1M$4.1M2026−65%

Every line of the income statement as filed: the last 3 fiscal years, latest first.4

Period ending2026-01-312025-01-312024-01-31
Net sales$697.1M$680.6M$700.3M
Cost of merchandise sold$303.9M$282.8M$299.2M
Gross profit$393.2M$397.8M$401.0M
Selling, general and administrative expenses$284.0M$281.4M$264.3M
Advertising and marketing$88.7M$88.0M$94.0M
Depreciation and amortization$15.2M$14.7M$12.6M
Total operating expenses$387.9M$384.2M$371.0M
Operating income$5.4M$13.6M$30.1M
Interest and other income, net$1.3M$2.8M$1.7M
Net income before taxes$6.7M$16.4M$31.8M
Income tax expense$2.6M$4.9M$8.0M
Net income$4.1M$11.6M$23.9M
Basic (in dollars per share)$0.28$0.75$1.55
Diluted (in dollars per share)$0.28$0.69$1.45
Basic (in shares)14.7M shares15.5M shares15.4M shares
Diluted (in shares)14.7M shares16.8M shares16.5M shares

Compare LoveSac with another company

The story

Founded by Shawn David Nelson in 1995.1

Lovesac was created in 1995 by Shawn D. Nelson, who formerly hand-made the chairs and delivered them to other students at the University of Utah. In 2005, Nelson won Fox's Rebel Billionaire reality show. The company relocated from Salt Lake City to Stamford, Connecticut in 2006, as it raised private-equity capital in the area. Lovesac joined the Nasdaq stock exchange on Wednesday, June 27, 2018, trading under the symbol LOVE.

In January 2006, the company filed for Chapter 11 bankruptcy protection. They left Chapter 11 protection in August 2006.

In 2012, Lovesac was named the fastest growing furniture company in the U.S. by Furniture Today magazine as well as recognized for being one of the top 100 furniture companies.

According to founder Shawn David Nelson, Lovesac planned to move 75% of its production out of China by 2020, due to trade war tariffs. As of late 2019, 40% of Lovesac's manufacturing was done in Vietnam and Malaysia, which were free of the tariff levels.

From Wikipedia’s article on LoveSac, shared under CC BY-SA 4.0.6

Leadership

Who has led LoveSac, and when. Pick a name to see everywhere that person has worked.

Board members and other officers (16)

Products and brands

Sactionals are Lovesac's modular sectional couches.

Snugg Sofas, Loveseats, and Chairs offer Lovesac comfort and quality in a smaller (and simpler) footprint.

Sacs are premium bean bag chairs with proprietary filling (Durafoam).

PillowSac Chairs convert the PillowSac bean bag chair into a more structured accent chair.

From Wikipedia’s article on LoveSac, shared under CC BY-SA 4.0.6

Timeline

  1. Jun 26, 2018New chief executive Shawn David Nelson becomes CEO16
  2. 1995Founded Founded1

Filings

341 filings to the SEC since October 2021: 7 annual reports, 17 quarterly reports, 45 major events, 191 insider forms, 49 large holders, 32 other. The latest 20:

  1. Sep 11, 20264 EDGAR
  2. Sep 10, 202610-Q EDGAR
  3. Sep 10, 20268-K EDGAR
  4. Jul 21, 20264 EDGAR
  5. Jul 17, 20264 EDGAR
  6. Jul 16, 2026144 EDGAR
  7. Jun 24, 20264 EDGAR
  8. Jun 24, 20263 EDGAR
  9. Jun 23, 20264 EDGAR
  10. Jun 22, 20264 EDGAR
  11. Jun 22, 20264 EDGAR
  12. Jun 15, 20264 EDGAR
  13. Jun 15, 20264 EDGAR
  14. Jun 15, 20264 EDGAR
  15. Jun 15, 20268-K CURRENT REPORT EDGAR
  16. Jun 11, 202610-Q EDGAR
  17. Jun 11, 20268-K EDGAR
  18. Jun 10, 20264/A EDGAR
  19. Jun 10, 20264 EDGAR
  20. Jun 10, 20264 EDGAR

The 341 filings since October 2021 can be filtered by form type and year here when JavaScript is on.

Every filing from the last three years, summarized. The full record is on SEC EDGAR.

Insider trades and holders

Large holders

Investors who own more than 5% must tell the SEC: a 13D if they may seek to influence the company, a 13G if they hold passively. 49 such filings since October 2021, the latest 10:

  1. May 14, 2026SCHEDULE 13G/A
  2. May 14, 2026SCHEDULE 13G/A
  3. Mar 30, 2026SCHEDULE 13G
  4. Mar 27, 2026SCHEDULE 13G/A
  5. Feb 24, 2026SCHEDULE 13G
  6. Feb 17, 2026SCHEDULE 13G/A
  7. Feb 13, 2026SCHEDULE 13G/A
  8. Feb 13, 2026SCHEDULE 13G
  9. Feb 12, 2026SCHEDULE 13G/A
  10. Jan 21, 2026SCHEDULE 13G/A

From Forms 4 and Schedules 13D and 13G filed with the SEC.

Held by these funds

The largest holders among investment managers' 13F reports for the quarter ending Jun 30, 2026, the top 25 of 100. Change is in shares since the quarter before.

FundSharesValueShare of the fundChange
BlackRock, Inc.1,213,318$20.3M0.0%+170,737
Anson Funds Management LP1,183,986$19.8M1.8%−1,183,986
Senvest Management, LLC990,212$16.5M0.5%−35,181
Fmr LLC980,626$16.4M0.0%−64,105
Hood River Capital Management LLC953,213$15.9M0.1%−17,684
Arrowstreet Capital, Limited Partnership755,111$12.6M0.0%−7,727
Dimensional Fund Advisors LP625,820$10.4M0.0%+38,121
AWM Investment Company, Inc.610,402$10.2M0.9%+110,400
Vanguard Capital Management LLC598,919$10.0M0.0%+1,252
Invenomic Capital Management LP413,318$6.9M0.4%−53,430
Nomura Holdings Inc405,015$6.8M0.0%+4
Geode Capital Management, LLC364,449$6.1M0.0%+26,716
Bastion Asset Management Inc.344,484$5.4M1.8%−11,613
Skylands Capital, LLC314,647$5.3M0.6%−18,300
State Street Corp286,722$4.8M0.0%−12,836
Aqr Capital Management LLC272,794$4.6M0.0%+238,851
BCGM Wealth Management, LLC263,157$4.4M0.9%+11,717
Isthmus Partners, LLC248,115$4.1M0.4%+7,929
D. E. Shaw & Co., Inc.221,315$3.7M0.0%+10,718
American Century Companies Inc198,533$3.3M0.0%+161,381
Soltis Investment Advisors LLC167,313$2.8M0.2%+91,031
Morgan Stanley159,818$2.7M0.0%−580
Vanguard Portfolio Management LLC148,943$2.5M0.0%+19,516
Goldman Sachs Group Inc119,564$2.0M0.0%−15,779
Northern Trust Corp112,752$1.9M0.0%+13,014

13F reports cover disclosed long positions in U.S. stocks only.

Sources

The numbers on this page point here. Each one links to the record it came from.

  1. 1
  2. 2
  3. 3
  4. 4
  5. 5
  6. 6
  7. 7
    Company websiteLoveSac photo
  8. 8
  9. 9
  10. 10
  11. 11
  12. 12
  13. 13
  14. 14
  15. 15
  16. 16
  17. 17
  18. 18
  19. 19
  20. 20
  21. 21
  22. 22
  23. 23
  24. 24
  25. 25
  26. 26
  27. 27
  28. 28
  29. 29
  30. 30
  31. 31
  32. 32
  33. 33
  34. 34
  35. 35