

QDEL on Nasdaq

Quidel

Logo: quidel.com4

American healthcare company

QuidelOrtho Corporation is an American manufacturer of diagnostic healthcare products that are sold worldwide. On May 8, 2020 the U.S. Food and Drug Administration (FDA) issued to Quidel the first emergency use authorization (EUA) for a COVID-19 rapid antigen test, a new category of tests for use in the ongoing pandemic.3 From Wikipedia, CC BY-SA 4.0

Price unavailable

Last updated Oct 18, 2026.

Overview

1979Founded1

Compare with IDEXX Laboratories, Inc., Lantheus Holdings, Inc. or NeoGen, or pick any stock.

  • TickerQDEL on Nasdaq1
  • Industryhealth care industry1
  • HeadquartersSan Diego1
  • Websitewww.quidel.com
  • Business address9975 Summers Ridge Road, San Diego, Ca 921215
  • Filer categoryLarge accelerated filer5
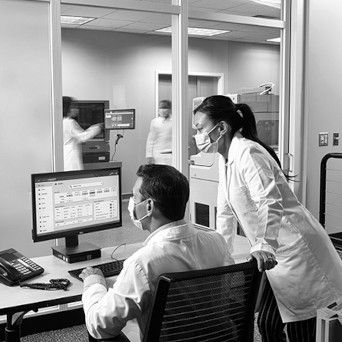
Quidel image from its website
Image: quidel.com4

QuidelOrtho Corporation is an American manufacturer of diagnostic healthcare products that are sold worldwide.3

Financials

From the company’s reports to the SEC. Every number links to the filing it came from.

Key numbers, fiscal 2025

-33.7%Operating margin7
-41.5%Net margin7
-1.9%Revenue growth, 20257
-58.9%Return on equity7
1.40×Debt to equity7
-$83.0MFree cash flow7

What sells

Revenue by product, business segment and region, as the company reports it to the SEC.

Business segments

North America brought in 55% of the revenue Quidel broke down this way in fiscal 2025.

  1. North America$1.5B755%down 8% from 2024
  2. EMEA$360.7M713%up 7% from 2024
  3. China$334.7M712%up 3% from 2024
  4. JPAC$293.0M711%up 5% from 2024
  5. Latin America$252.9M79%up 13% from 2024
Business segments by year
Business segments202320242025
North America$1.9B$1.6B$1.5B
EMEA$327.3M$335.8M$360.7M
China$310.1M$325.0M$334.7M
JPAC$272.7M$279.4M$293.0M
Latin America$210.6M$222.9M$252.9M

Regions

Domestic Tax Jurisdiction brought in 53% of the revenue Quidel broke down this way in fiscal 2025.

  1. Domestic Tax Jurisdiction$1.4B753%down 8% from 2024
  2. Foreign Tax Jurisdiction$1.3B747%up 7% from 2024
Regions by year
Regions202320242025
Domestic Tax Jurisdiction$1.8B$1.6B$1.4B
Foreign Tax Jurisdiction$1.2B$1.2B$1.3B

Where the money goes

Where each dollar of revenue went, fiscal 2025

  • Research and development7¢$186.2M
  • Selling, general and admin27¢$746.3M
  • Other costs65¢$1.8B
  • Income tax1¢$24.1M

Out of $2.7B in revenue.7 The company lost money this year.

Where each dollar of operating cash went, fiscal 2025

  • Capital spending100¢$188.2M

Out of $105.2M of cash from operations. Spending exceeded cash from operations; the rest came from savings or borrowing.7

Financial statements

Revenue897$2.7B in 2025+410% since 2019
0$1.0B$2.0B$3.0B2019: $534.9M$534.9M20192020: $1.7B$1.7B2020+211%2021: $1.7B$1.7B2021+2%2022: $1.7B$1.7B2022+0%2023: $3.0B$3.0B2023+76%2024: $2.8B$2.8B2024−7%2025: $2.7B$2.7B2025−2%
Gross profit8$1.3B in 2021+296% since 2019
0$500.0M$1.0B$1.5B2019: $320.8M$320.8M20192020: $1.3B$1.3B2020+320%2021: $1.3B$1.3B2021−6%
Operating income897-$919.2M in 2025
-$2.0B-$1.0B0$1.0B$2.0B2019: $92.7M$92.7M20192020: $1.1B$1.1B2020+1044%2021: $906.1M$906.1M2021−15%2022: $906.0M$906.0M2022−0%2023: $139.1M$139.1M2023−85%2024: -$2.0B-$2.0B20242025: -$919.2M-$919.2M2025−53%
Net income897-$1.1B in 2025
-$3.0B-$2.0B-$1.0B0$1.0B2019: $72.9M$72.9M20192020: $810.3M$810.3M2020+1011%2021: $704.2M$704.2M2021−13%2022: $704.2M$704.2M2022−0%2023: -$10.1M-$10.1M20232024: -$2.1B-$2.1B2024+20217%2025: -$1.1B-$1.1B2025−45%

Every line of the income statement as filed: the last 3 fiscal years, latest first.7

Period ending2025-12-312024-12-312023-12-31
Total revenues$2.7B$2.8B$3.0B
Cost of sales, excluding amortization of intangibles$1.5B$1.5B$1.5B
Selling, marketing and administrative$746.3M$766.8M$763.2M
Research and development$186.2M$218.7M$245.0M
Amortization of intangible assets$189.2M$203.4M$204.8M
Restructuring, integration and other charges$263.6M$127.2M$113.4M
Goodwill impairment charge$700.7M$1.8B$0
Asset impairment charge$9.7M$56.9M$4.5M
Other operating expenses$97.7M$51.8M$27.1M
Operating (loss) income-$919.2M-$2.0B$139.1M
Interest expense, net$177.6M$163.5M$147.6M
Loss on extinguishment of debt$5.1M$0$0
Other expense, net$5.8M$7.1M$20.6M
Loss before income taxes-$1.1B-$2.1B-$29.1M
Provision for (benefit from) income taxes$24.1M-$79.5M-$19.0M
Net loss-$1.1B-$2.1B-$10.1M
Basic loss per share-$16.69-$30.54-$0.15
Diluted loss per share-$16.69-$30.54-$0.15
Weighted-average shares outstanding - basic67.8M shares67.2M shares66.8M shares
Weighted-average shares outstanding - diluted67.8M shares67.2M shares66.8M shares

Compare Quidel with another company

The story

Quidel was founded by Dr. David H. Katz, M.D., commencing operations in 1981 and launched its first products in 1984. Quidel Corporation was formed in 1991 when Quidel and Monoclonal Antibodies merged.

In 1988, Dr. Katz, a founder and chief scientific officer at Quidel, resigned to devote his energies to the Medical Biology Institute, a nonprofit research group in La Jolla, California that is closely allied with Quidel.

On June 18, 1997 Quidel settled a lawsuit with Becton Dickinson. Quidel had been accused of infringing patents on Becton's strep and chlamydia products. Quidel agreed to buy a product license and pay royalties on its product sales.

In 1999, Quidel acquired Metra Biosystems, Inc. to participate in bone health assessment. In 2000, Quidel acquired Litmus Concepts, Inc., a privately held in vitro diagnostic company.

In February 2004, Inverness Medical Innovations sued Quidel for patent infringement. That same month, Quidel countersued against Inverness.

In 2010, Quidel acquired Diagnostic Hybrids, Inc. a privately held in vitro diagnostic company. In 2013, Quidel acquired BioHelix Corporation, established in 2004, and was to pay $10 million to the BioHelix shareholders.

In May 2020, Quidel’s Sofia 2 SARS Antigen FIA has become the first COVID-19 rapid antigen test to be granted Emergency Use Authorization (EUA) by the FDA, approved by FDA director in charge of authorizing test EUAs, Tim Stenzel. Stenzel was also Quidel’s former Chief Science Officer who, while leading Quidel, oversaw the initial launch of the Sofia instrument.

In December 2021, Quidel announced it would acquire Ortho Clinical Diagnostics Holdings for $6 billion in cash and stock, increasing the range of COVID-19 antigen and antibody tests the business is able to offer.

Read the full text

In February 2024, CEO Douglas Bryant was fired, being replaced by Michael Iskra as interim CEO.

List of mergers and acquisitions

The following is an illustration of the company's major mergers and acquisitions and historical predecessors:

From Wikipedia’s article on QuidelOrtho, shared under CC BY-SA 4.0.6

Leadership

Who has led Quidel, and when. Pick a name to see everywhere that person has worked.

Board members and other officers (60)

Products and brands

Quidel's current products fall generally into these categories: (1) lateral flow, where it focuses on infectious disease and reproductive health; (2) direct fluorescent antibodies (DFA), with expertise in infectious disease and virology; (3) micro-titer production, with a focus on bone and complement pathway markets; (4) fluorescent immunoassay products (Sofia); and (5) molecular diagnostic products.

These products include assays such as QuickVue, Thyretain and the new Sofia and AmpliVue brands, which focus on diagnosing influenza, thyroid disease, and many other diseases, and can improve the healthcare quality of hospitals.

During 2011, the US Food and Drug Administration (FDA) and the European Conformity Mark provided Quidel with 510(k) clearance for selling Sofia Analyzer, and another 510(k) clearance for the Quidel Molecular hMPV Assay.

From Wikipedia’s article on QuidelOrtho, shared under CC BY-SA 4.0.6

Former names

  • Coronado Topco, Inc.Jan 31, 2022 to Apr 11, 20225

Timeline

  1. May 16, 2024New chief executive Brian J. Blaser becomes CEO16
  2. Feb 29, 2024New chief executive Michael S. Iskra becomes CEO15
  3. Jul 6, 2022Parent Directly consolidated by QuidelOrtho Corporation84
  4. Feb 4, 2009New chief executive Douglas C. Bryant becomes CEO18
  5. Mar 23, 2006New chief executive Caren L. Mason becomes CEO19
  6. 1979Founded Founded1

Filings

602 filings to the SEC since October 2021: 7 annual reports, 15 quarterly reports, 67 major events, 393 insider forms, 56 large holders, 64 other. The latest 20:

  1. Oct 7, 2026SCHEDULE 13G/A EDGAR
  2. Sep 23, 20268-K EDGAR
  3. Sep 17, 20264 EDGAR
  4. Aug 18, 20264 EDGAR
  5. Aug 14, 2026SCHEDULE 13G/A EDGAR
  6. Aug 14, 2026SCHEDULE 13G/A EDGAR
  7. Aug 13, 2026SCHEDULE 13G EDGAR
  8. Aug 7, 202610-Q EDGAR
  9. Aug 6, 20268-K EDGAR
  10. Aug 5, 2026SCHEDULE 13G/A EDGAR
  11. Jul 16, 20264 EDGAR
  12. Jul 15, 20263 EDGAR
  13. Jul 13, 2026S-8 EDGAR
  14. Jul 8, 2026SCHEDULE 13G EDGAR
  15. Jul 2, 20264 EDGAR
  16. Jun 29, 20264 EDGAR
  17. Jun 29, 20264 EDGAR
  18. Jun 29, 20264 EDGAR
  19. Jun 29, 20264 EDGAR
  20. Jun 29, 20264 EDGAR

The 602 filings since October 2021 can be filtered by form type and year here when JavaScript is on.

Every filing from the last three years, summarized. The full record is on SEC EDGAR.

Insider trades and holders

Large holders

Investors who own more than 5% must tell the SEC: a 13D if they may seek to influence the company, a 13G if they hold passively. 56 such filings since October 2021, the latest 10:

  1. Oct 7, 2026SCHEDULE 13G/A
  2. Aug 14, 2026SCHEDULE 13G/A
  3. Aug 14, 2026SCHEDULE 13G/A
  4. Aug 13, 2026SCHEDULE 13G
  5. Aug 5, 2026SCHEDULE 13G/A
  6. Jul 8, 2026SCHEDULE 13G
  7. May 7, 2026SCHEDULE 13G/A
  8. May 6, 2026SCHEDULE 13G/A
  9. May 6, 2026SCHEDULE 13G
  10. May 6, 2026SCHEDULE 13G/A

From Forms 4 and Schedules 13D and 13G filed with the SEC.

Held by these funds

The largest holders among investment managers' 13F reports for the quarter ending Jun 30, 2026, the top 25 of 100. Change is in shares since the quarter before.

FundSharesValueShare of the fundChange
BlackRock, Inc.11,202,523$196.2M0.0%+753,396
Fmr LLC7,363,696$129.0M0.0%+772,544
Newtyn Management, LLC6,625,000$116.0M14.5%+2,066,528
Vanguard Portfolio Management LLC4,135,464$72.4M0.0%+103,696
Neuberger Berman Group LLC3,534,619$62.1M0.0%+2,004,205
Invesco Ltd.3,473,432$60.8M0.0%+355,963
American Century Companies Inc3,307,079$57.9M0.0%+450,947
Rubric Capital Management LP3,306,281$57.9M0.5%No change
Vanguard Capital Management LLC3,070,054$53.8M0.0%+17,344
State Street Corp2,978,639$52.2M0.0%+192,018
Paradigm Capital Management Inc/ny2,521,700$44.2M1.2%+995,800
Private Management Group Inc2,070,391$36.3M1.0%+685,622
Geode Capital Management, LLC1,834,237$32.1M0.0%+119,038
Morgan Stanley1,675,525$29.3M0.0%+652,015
Segall Bryant & Hamill, LLC1,345,530$23.6M0.3%−197,880
Dimensional Fund Advisors LP1,253,683$22.0M0.0%−1,795,085
Allianz Asset Management GmbH1,126,225$19.7M0.0%+119,888
Goldman Sachs Group Inc1,064,744$18.6M0.0%−1,347,667
Rice Hall James & Associates, LLC1,063,559$18.6M0.9%+37,139
Gagnon Securities LLC1,030,371$18.0M3.5%+627,046
Charles Schwab Investment Management Inc1,018,104$17.8M0.0%+188,045
Aqr Capital Management LLC911,115$16.0M0.0%+736,395
Buckley Capital Advisors, LLC850,335$14.9M9.3%New
Northern Trust Corp751,078$13.2M0.0%+61,284
Millennium Management LLC722,480$12.7M0.0%+440,263

13F reports cover disclosed long positions in U.S. stocks only.

Members of Congress who traded it

1 trades disclosed by members of Congress. “Vs S&P since” is the stock’s change since the trade minus the S&P 500’s.

DateMemberTradeAmountVs S&P sinceFiling
Jul 12, 2023Daniel S. GoldmanDemocratic, HouseSale$1,001 - $15,000+157.1%Report

Members report amounts as ranges, not exact figures. Returns are price-only (no dividends).

Sources

The numbers on this page point here. Each one links to the record it came from.

  1. 1
  2. 2
  3. 3
  4. 4
    Company websiteQuidel logo
  5. 5
  6. 6
  7. 7
  8. 8
  9. 9
  10. 10
  11. 11
  12. 12
  13. 13
  14. 14
  15. 15
  16. 16
  17. 17
  18. 18
  19. 19
  20. 20
  21. 21
  22. 22
  23. 23
  24. 24
  25. 25
  26. 26
  27. 27
  28. 28
  29. 29
  30. 30
  31. 31
  32. 32
  33. 33
  34. 34
  35. 35
  36. 36
  37. 37
  38. 38
  39. 39
  40. 40
  41. 41
  42. 42
  43. 43
  44. 44
  45. 45
  46. 46
  47. 47
  48. 48
  49. 49
  50. 50
  51. 51
  52. 52
  53. 53
  54. 54
  55. 55
  56. 56
  57. 57
  58. 58
  59. 59
  60. 60
  61. 61
  62. 62
  63. 63
  64. 64
  65. 65
  66. 66
  67. 67
  68. 68
  69. 69
  70. 70
  71. 71
  72. 72
  73. 73
  74. 74
  75. 75
  76. 76
  77. 77
  78. 78
  79. 79
  80. 80
  81. 81
  82. 82
  83. 83
  84. 84