

Overview
Compare with BIG SKY INDUSTRIAL INC., MEXCO ENERGY CORP or Viking Global Technologies, Inc., or pick any stock.
- TickerTRLEF on OTC1
- Industrypetroleum industry1
- HeadquartersVancouver1
- Websitetrillionenergy.com
- Listed onCanadian Securities Exchange (TCF), Frankfurt Stock Exchange (Z62), OTCQB Marketplace (TRLEF)1
- Incorporated inBritish Columbia, Canada4
- Business addressTuran Gunes Bulvari,Park Oran Ofis Plaza, 180-Y, Daire:54, Kat:16, Oran, Cankaya, Ankara4
- Filer categoryNon-accelerated filer4
- Legal formCorporation
See how the biggest companies compare on our leaderboards
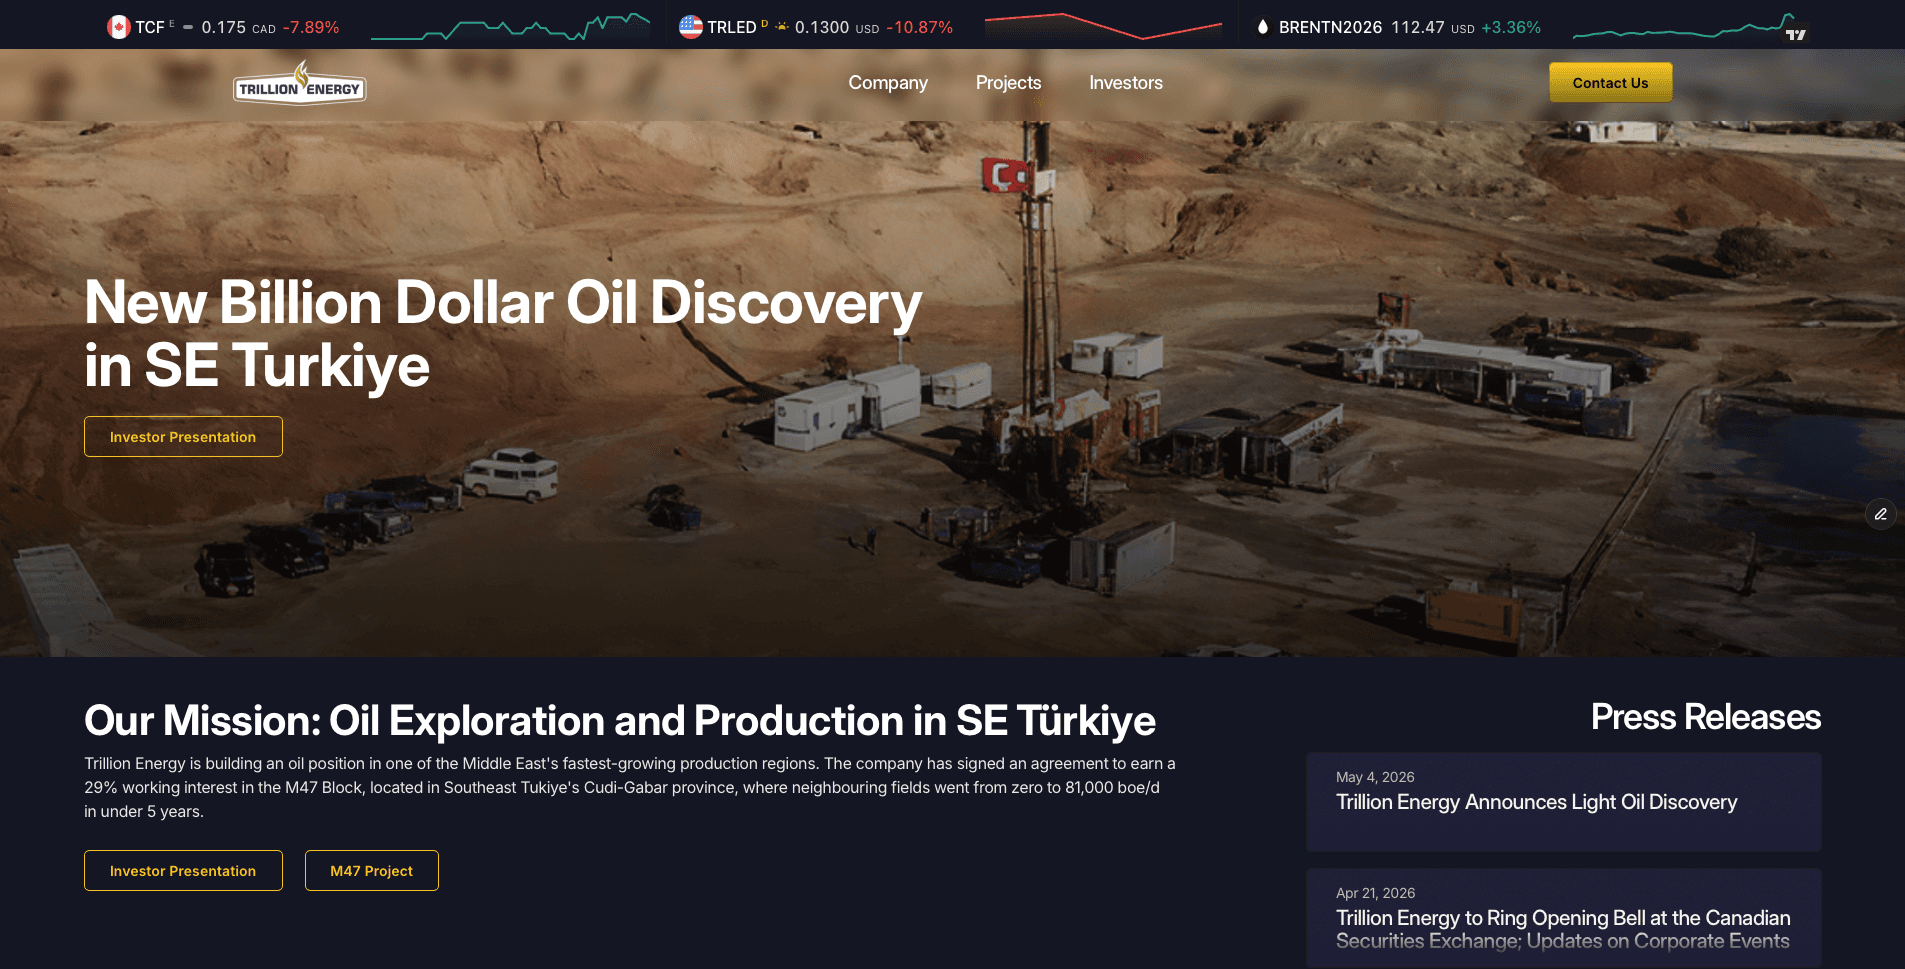
Pivot occurred after disappointing performance of SASB gas field, which producing diminished during the year due to water-loading issues.5 From its latest annual report
Financials
From the company’s reports to the SEC. Every number links to the filing it came from.
Key numbers, fiscal 2024
Where the money goes
Where each dollar of revenue went, fiscal 2024
- Other costs46¢$3.2M
- Interest19¢$1.3M
- Income tax35¢$2.4M
Out of $7.0M in revenue.6 The company lost money this year.
Financial statements
No quarterly figures reported.
Every line of the income statement as filed: the last 3 fiscal years, latest first.10
| Period ending | 2025-12-31 | 2024-12-31 | 2023-12-31 |
|---|---|---|---|
| Oil and gas revenue, net | $2.9M | $7.0M | $16.8M |
| Production | $2.4M | $4.8M | $4.4M |
| Depletion | $139.6K | $1.3M | $5.1M |
| Depreciation | $64.8K | $87.4K | $175.8K |
| Accretion of asset retirement obligation | $269.4K | $269.1K | $219.5K |
| Stock-based compensation | $18.5K | $1.1M | $2.4M |
| General and administrative | $5.2M | $6.2M | $7.3M |
| Geological and geophysical expenses | $44.1K | $1.4M | $706.4K |
| Total expenses | $8.1M | $15.1M | $20.3M |
| Loss before other income (expenses) | -$5.2M | -$8.1M | -$3.5M |
| Interest income | $226.0K | $53.4K | $19.2K |
| Finance cost | -$3.1M | -$2.6M | -$2.2M |
| Foreign exchange gain (loss) | -$3.2M | -$3.8M | -$9.9M |
| Loss on extinguishment accounts payable and loan payable | -$264.1K | -$8.5K | |
| Change in fair value of derivative liability | $4.8K | ||
| Gain on debt modification and settlement for shares | $577.7K | ||
| Loss on write-off of notes and other receivables | -$101.3K | -$15.4K | |
| Loss on impairment and sale of assets held for sale | -$328.6K | -$132.7K | -$1.6M |
| Impairment of oil and gas properties | -$54.5M | -$9.9M | |
| Loss on issuance of shares | -$5.1K | -$17.3K | |
| Gain on net monetary position | $12.8M | $18.4M | $19.0M |
| Gain (loss) on sale of oil and gas properties and equipment | $74.3K | -$466.1K | $19.5K |
| Gain on modification and termination of lease | $32.6K | $46.6K | $31.9K |
| Other income | $2.4K | ||
| Total other income (expense) | -$47.5M | $1.4M | $5.3M |
| Income (loss) before taxes | -$52.7M | -$6.7M | $1.8M |
| Deferred tax recovery (expense) | $3.5M | -$2.4M | -$1.9M |
| Net loss | -$49.2M | -$9.1M | -$43.8K |
| Foreign currency translation | -$5.2M | -$3.3M | -$10.0M |
| Total comprehensive loss | -$54.4M | -$12.5M | -$10.1M |
| Net loss per share - Basic | -$1.30 | -$0.32 | $0.00 |
| Net loss per share - Diluted | -$1.30 | -$0.32 | $0.00 |
| Weighted average shares outstanding Basic | 37.8M shares | 28.5M shares | 16.2M shares |
| Weighted average shares outstanding Diluted | 37.8M shares | 28.5M shares | 16.2M shares |
No quarter-by-quarter statement was filed.
No quarterly figures reported.
Every line of the balance sheet as filed: the last 4 fiscal years (annual) or 4 quarters (quarterly), latest first.10
| Period ending | 2025-12-31 | 2024-12-31 | 2023-12-31 | 2022-12-31 |
|---|---|---|---|---|
| Cash and cash equivalents | $430.3K | $599.2K | $1.2M | $926.1K |
| Amounts receivable | $737.8K | $1.4M | ||
| Prepaid expenses and deposits | $46.9K | $255.8K | ||
| Assets held for sale | $387.8K | $1.5M | ||
| Total current assets | $1.2M | $2.6M | ||
| Oil and gas properties, net | $721.4K | $50.8M | ||
| Property and equipment, net | $409.9K | $741.7K | ||
| Long-term deposits | $756.6K | $686.2K | ||
| Total assets | $3.1M | $54.9M | ||
| Accounts payable and accrued liabilities | $18.8M | $14.8M | ||
| Loans payable | $5.0M | $5.4M | ||
| Convertible debt | $11.8M | $10.4M | ||
| Lease liability | $10.4K | |||
| Total current liabilities | $35.6M | $30.5M | ||
| Asset retirement obligation | $6.4M | $5.9M | $6.2M | |
| Lease liability | $35.0K | |||
| Deferred tax liability | $4.2M | $2.1M | ||
| Total liabilities | $42.0M | $40.7M | ||
| Share capital | $79.6M | $78.4M | ||
| Notes and amounts receivable for equity issued | -$90.4K | |||
| Warrant and option reserve | $7.2M | $7.2M | ||
| Shares to be cancelled | $7.6K | |||
| Obligation to issue shares | $54.0K | $6.0K | ||
| Accumulated other comprehensive loss | -$22.6M | -$17.4M | ||
| Accumulated deficit | -$103.2M | -$54.0M | ||
| Total stockholders (deficiency) equity | -$38.9M | $14.1M | $22.2M | $20.6M |
| Total liabilities and stockholders (deficiency) equity | $3.1M | $54.9M |
Cash flow is reported year to date, not quarter by quarter, so there are no separate quarterly figures.
Every line of the cash flow as filed: the last 3 fiscal years, latest first.10
| Period ending | 2025-12-31 | 2024-12-31 | 2023-12-31 |
|---|---|---|---|
| Net loss for the year | -$49.2M | -$9.1M | -$43.8K |
| Stock-based compensation | $18.5K | $1.1M | $2.4M |
| Stock issued for services | $121.9K | $251.8K | $89.7K |
| Depletion | $139.6K | $1.3M | $5.1M |
| Depreciation | $64.8K | $87.4K | $175.8K |
| Accretion of asset retirement obligation | $269.4K | $269.1K | $219.5K |
| Accretion and accrued interest expense | $2.5M | $1.2M | $1.4M |
| Interest income | -$18.1K | -$2.2K | -$19.2K |
| Change in fair value of derivative liability | -$4.8K | ||
| Unrealized foreign exchange (gain) loss | $2.9M | $1.2M | $4.3M |
| (Gain) loss on debt modification and settlement for shares | -$577.7K | $264.1K | $8.5K |
| Loss on issuance of shares | $5.1K | $17.3K | |
| Loss (gain) on sale of oil and gas properties and equipment | -$74.3K | $466.1K | -$19.5K |
| Loss on impairment of O&G assets | $54.5M | $9.9M | |
| Loss on sale and revaluation of assets held for sale | $328.6K | $132.7K | $1.6M |
| Loss on write-off of notes and other receivables | $101.3K | $15.4K | |
| Gain on net monetary position | -$12.8M | -$18.4M | -$19.0M |
| Gain on modification and termination of lease | -$32.6K | -$46.6K | -$31.9K |
| Deferred tax (recovery) expense | -$3.5M | $2.4M | $1.9M |
| Amounts receivable | $404.9K | -$29.3K | $1.4M |
| Prepaid expenses and deposits | $186.7K | $273.4K | -$677.2K |
| Accounts payable and accrued liabilities | $5.9M | $3.1M | -$346.4K |
| Net cash provided by (used in) operating activities | $1.2M | -$5.7M | -$1.5M |
| Property and equipment expenditures | -$12.7K | -$15.3K | -$60.2K |
| Oil and gas properties expenditures | -$721.7K | -$2.1M | -$56.4M |
| Disposal of equipment and assets held for sale | $21.2K | $1.3M | |
| Advances from JV Partners | $379.4K | $1.3M | $29.6M |
| Prepaid expenses and deposits | -$191.4K | -$372.1K | $178.5K |
| Accounts payable and accrued liabilities | -$265.6K | $692.9K | $7.9M |
| Net cash (used in) provided by investing activities | -$790.6K | $777.1K | -$18.8M |
| Proceeds from stock subscriptions received, net | $1.7M | $7.4M | |
| Proceeds from exercise of options | $542.9K | ||
| Proceeds from exercise of warrants | $2.2K | $2.2K | |
| Proceeds from loans payable | $1.3M | $2.4M | $5.0M |
| Repayments of loans payable | -$1.9M | -$357.6K | -$2.7M |
| Repayment of notes receivable | $81.0K | ||
| Proceeds from convertible debt | $10.4M | ||
| Lease payments | -$14.4K | -$22.9K | -$85.3K |
| Net cash (used in) provided by financing activities | -$548.0K | $3.7M | $20.6M |
| Effect of exchange rate changes on cash and cash equivalents | -$74.4K | $605.3K | -$14.4K |
| Net (decrease) increase in cash and cash equivalents | -$168.9K | -$589.2K | $262.4K |
| Interest paid on credit facilities | $281.0K | $1.4M | $795.5K |
| Interest paid on convertible debt | $1.3M | ||
| Stock issued for debt settlement | $400.8K | $1.5M | $212.4K |
| Stock issued for convertible debenture interest | $754.3K | ||
| Right-of-use asset additions | $236.2K |
No quarter-by-quarter statement was filed.
Compare Trillion Energy International Inc. with another company
What it owns
What Trillion Energy International Inc. reports owning in its annual reports to the SEC: buildings, land and equipment, real estate and locations, investments, intangible assets and inventory, at the end of its latest fiscal year and a year before.
Property and equipment
| Item | Latest | A year before | Change |
|---|---|---|---|
| Property and equipment, net | $741.7K6 Dec 31, 2024 | $720.5K6 Dec 31, 2023 | +2.9% |
Investments
Leadership
Who has led Trillion Energy International Inc., and when. Pick a name to see everywhere that person has worked.
Chief executive
Chief financial officer
- Chief executive officerScott C. Larsen Jan 4, 2016 to Apr 4, 201712
- PresidentArthur Halleran Dec 6, 2018 to Nov 15, 202113
- PresidentScott C. Larsen Jan 4, 2016 to Apr 4, 201712
- Chief financial officerCharles Michel Mar 29, 2017 to Mar 29, 201714
Board members and other officers (5)
- Secretary & TreasurerFrancis M. Munchinski Jan 4, 2016 to Mar 29, 201715
- Board memberKubilay Yildirim Jul 31, 2020 to Nov 12, 202116
- Board memberScott C. Larsen Jan 4, 2016 to Apr 4, 201712
- Board memberArthur Halleran Jan 25, 2016 to Nov 15, 202117
- Board memberMohammad Ijaz Khan Jan 25, 2016 to Apr 4, 201718
Named in SEC Form D filings
People the company listed in its private-offering notices.
- Executive Officer, DirectorDavid M. Thompson named Apr 1, 2022 to Jul 30, 202619
- Corporate SecretaryRenata Burak Kubicek named Jul 30, 202619
- Executive Officer, DirectorScott M. Lower named Jul 30, 202619
- Executive Officer, DirectorSean M. Stofer named Jul 30, 202619
- Vice-PresidentTolga Burak Terzi named Jul 30, 202619
- DirectorJay M. Park named Jul 30, 202619
- DirectorBarry M. Wood named Apr 1, 2022 to Jul 8, 202220
Former names
- Park Place Energy Inc.until Apr 1, 20191
Timeline
Filings
114 filings to the SEC since October 2021: 8 annual reports, 1 quarterly reports, 1 major events, 4 insider forms, 3 private raises, 97 other. The latest 20:
- Sep 1, 20266-K EDGAR
- Aug 5, 20266-K EDGAR
- Jul 30, 2026D EDGAR
- Jul 15, 20266-K EDGAR
- Jul 15, 20266-K EDGAR
- Jun 30, 20266-K/A EDGAR
- Jun 11, 20266-K EDGAR
- Jun 11, 20266-K EDGAR
- Jun 11, 20266-K EDGAR
- Jun 11, 20266-K EDGAR
- Jun 11, 20266-K EDGAR
- Jun 11, 20266-K EDGAR
- Jun 1, 20266-K EDGAR
- May 27, 202620-F EDGAR
- May 11, 20266-K EDGAR
- May 11, 20266-K EDGAR
- May 11, 20266-K EDGAR
- May 4, 2026NT 20-F EDGAR
- Apr 24, 20266-K EDGAR
- Apr 24, 20266-K EDGAR
The 114 filings since October 2021 can be filtered by form type and year here when JavaScript is on.
Every filing from the last five years, summarized. The full record is on SEC EDGAR.
Money raised
Private offerings the company reported to the SEC on Form D.
SEC filer profile
How Trillion Energy International Inc. is registered with the Securities and Exchange Commission, from its EDGAR record and the cover page of its latest annual report.
- Name on EDGARDune Oil Corp.2
- CIK0001648636
- Employer ID (EIN)47-44885522
- Filer statusNon-accelerated filer not an emerging growth company; a shell company5
- Incorporated inA15
- Fiscal year endsDecember 312
- Industry code (SIC)1311 Crude Petroleum & Natural Gas2
- SEC reviewing officeOffice of Energy & Transportation, Division of Corporation Finance2
- Business addressTuran Gunes Bulvari,Park Oran Ofis Plaza, 180-Y, Daire:54, Kat:16, Oran, Cankaya, Ankara, Turkey2
- Phone1 (250) 996-4212
- Shares outstanding41,624,457 shares as of Dec 31, 20255
- AuditorMNP LLP, Calgary, Canada PCAOB ID 19305
- On EDGAR sinceJul 21, 20152
- Filings266 in all: 6-K (76), 4 (67), 8-K (29), 10-Q (18), CORRESP (11), NT 10-Q (9), 10-K (6), UPLOAD (6)2
All 28 form types
20-F (5), NT 10-K (4), NT 20-F (4), 10-Q/A (3), 20-F/A (3), 4/A (3), D (3), S-4/A (3), 6-K/A (2), DEF 14A (2), EFFECT (2), S-4 (2), 10-K/A (1), 144 (1), 424B3 (1), 424B5 (1), 8-A12G (1), 8-K/A (1), DEFA14A (1), PRE 14A (1)
- Latest filingsAnnual report (20-F) May 27, 2026
Quarterly report (10-Q) Nov 15, 2021
Proxy statement (DEF 14A) Nov 12, 2021
Latest 8-K (8-K) Nov 18, 2021
Links
- Websitetrillionenergy.com1
- LinkedInwww.linkedin.com/company/trillion-energy-international-inc1
- WikidataQ140399370
- SEC EDGARCIK 1648636
Sources
The numbers on this page point here. Each one links to the record it came from.
- 1
- 2
- 3Company websiteTrillion Energy International Inc. logo
- 4
- 5
- 6
- 7
- 8
- 9
- 10
- 11
- 12
- 13SEC EDGARArthur Halleran, President
- 14
- 15
- 16SEC EDGARKubilay Yildirim, Board member
- 17SEC EDGARArthur Halleran, Board member
- 18SEC EDGARMohammad Ijaz Khan, Board member
- 19
- 20
- 21SEC EDGARUnregistered sale of shares